Venn Diagram Worksheet: Teach Logic with Visual Ease
Introduction to Venn Diagrams
Venn diagrams are a powerful tool for teaching logic and set theory. They provide a visual representation of relationships between sets, making it easier for students to understand complex concepts. In this blog post, we will explore how to use Venn diagrams to teach logic with visual ease.
What is a Venn Diagram?
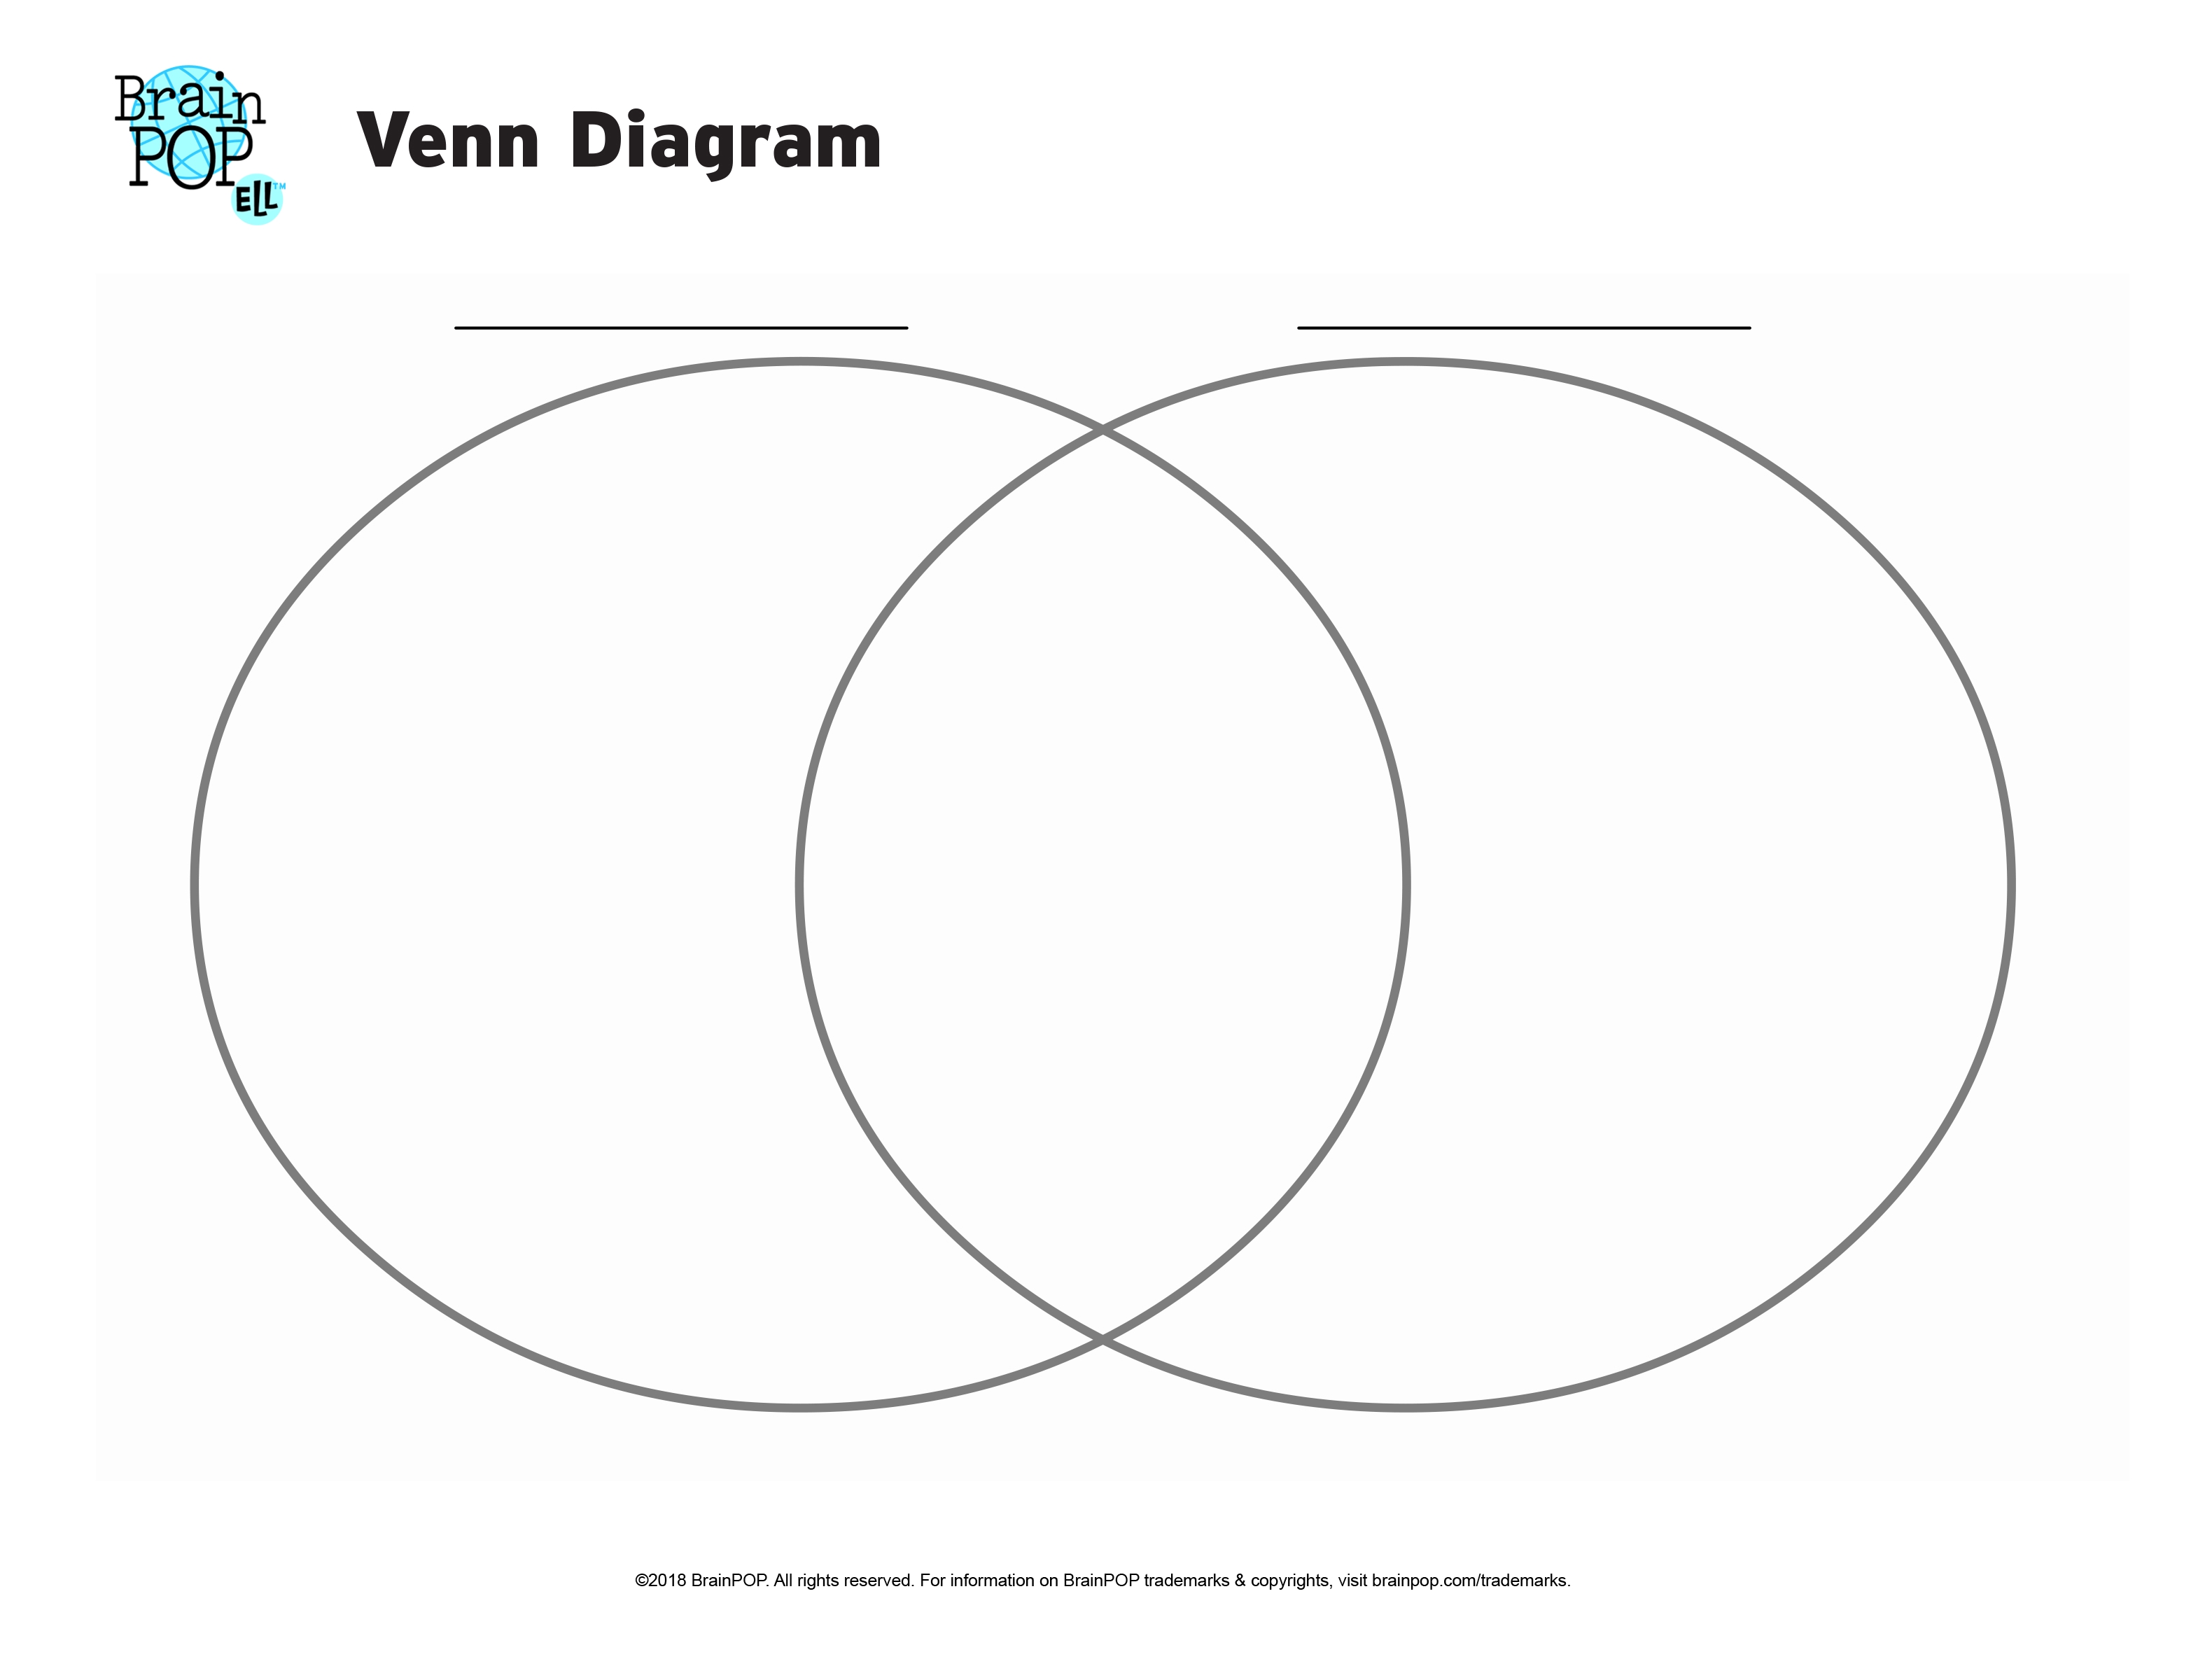
A Venn diagram is a diagram that shows the relationships between two or more sets. It consists of overlapping circles, each representing a set. The overlapping regions represent the elements that are common to both sets. Venn diagrams can be used to visualize various set operations, such as union, intersection, and difference.
Benefits of Using Venn Diagrams
Venn diagrams offer several benefits for teaching logic and set theory:
- Visual Representation: Venn diagrams provide a visual representation of complex concepts, making it easier for students to understand and remember.
- Improved Comprehension: By using Venn diagrams, students can better comprehend the relationships between sets and the various set operations.
- Enhanced Critical Thinking: Venn diagrams encourage critical thinking and problem-solving skills, as students need to analyze the relationships between sets and identify patterns.
How to Create a Venn Diagram
Creating a Venn diagram is a straightforward process. Here’s a step-by-step guide:
- Identify the Sets: Identify the sets you want to represent in the Venn diagram.
- Draw the Circles: Draw overlapping circles, each representing a set.
- Label the Circles: Label each circle with the name of the set it represents.
- Identify the Overlapping Regions: Identify the overlapping regions, which represent the elements common to both sets.
- Label the Overlapping Regions: Label the overlapping regions with the elements that are common to both sets.
Using Venn Diagrams to Teach Logic
Venn diagrams can be used to teach various logic concepts, including:
- Set Operations: Venn diagrams can be used to visualize set operations, such as union, intersection, and difference.
- Logical Operators: Venn diagrams can be used to represent logical operators, such as AND, OR, and NOT.
- Arguments and Inferences: Venn diagrams can be used to evaluate arguments and make inferences.
Example: Using Venn Diagrams to Teach Set Operations
Suppose we want to teach the concept of union and intersection using Venn diagrams. Here’s an example:
- Set A: Set A represents the set of students who like mathematics.
- Set B: Set B represents the set of students who like science.
- Union: The union of Set A and Set B represents the set of students who like either mathematics or science.
- Intersection: The intersection of Set A and Set B represents the set of students who like both mathematics and science.
📝 Note: Use different colors to highlight the overlapping regions and make the diagram more visually appealing.
Conclusion
Venn diagrams are a powerful tool for teaching logic and set theory. By using Venn diagrams, students can better comprehend complex concepts and develop critical thinking and problem-solving skills. With this blog post, you now have the knowledge to create your own Venn diagram worksheet and teach logic with visual ease.
What is the purpose of a Venn diagram?
+
A Venn diagram is used to visualize the relationships between sets, making it easier to understand complex concepts and develop critical thinking and problem-solving skills.
How do you create a Venn diagram?
+
To create a Venn diagram, identify the sets you want to represent, draw overlapping circles, label the circles, identify the overlapping regions, and label the overlapping regions.
What logic concepts can be taught using Venn diagrams?
+
Venn diagrams can be used to teach various logic concepts, including set operations, logical operators, and arguments and inferences.
