5 Ways to Master Ratio Tables and Graphs
Understanding Ratio Tables and Graphs
Ratio tables and graphs are essential tools in mathematics, particularly in algebra and geometry. They help students understand and visualize the relationships between different quantities, making it easier to solve problems and make informed decisions. However, mastering ratio tables and graphs can be challenging, especially for those who are new to these concepts. In this article, we will explore five ways to master ratio tables and graphs, providing you with the skills and confidence you need to succeed in mathematics.
1. Start with the Basics
Before diving into complex problems, it’s essential to understand the basics of ratio tables and graphs. A ratio table is a table that shows the relationship between two quantities, often represented by a ratio of equivalent values. For example, if you have a recipe that requires a ratio of 2:3 of flour to sugar, you can create a ratio table to show the relationship between the two quantities.
On the other hand, a graph is a visual representation of data, often used to show the relationship between two or more variables. In the context of ratio tables, graphs can be used to visualize the relationship between the two quantities.
To start with the basics, make sure you understand the following concepts:
- Equivalent ratios: These are ratios that have the same value, but with different numbers. For example, 2:3 is equivalent to 4:6.
- Proportional relationships: These are relationships between two quantities that are directly proportional to each other.
- Graphing basics: Understand the different types of graphs, including coordinate planes, x-y axes, and plotting points.
2. Practice Creating Ratio Tables
Creating ratio tables is an essential skill to master, as it helps you understand the relationship between two quantities. To practice creating ratio tables, follow these steps:
- Identify the ratio: Determine the ratio between the two quantities. For example, if you have a recipe that requires a ratio of 2:3 of flour to sugar, identify the ratio as 2:3.
- Create the table: Create a table with two columns, one for each quantity. In the first row, write the ratio, and in the subsequent rows, write the equivalent values.
- Fill in the table: Fill in the table with the equivalent values, making sure to maintain the same ratio.
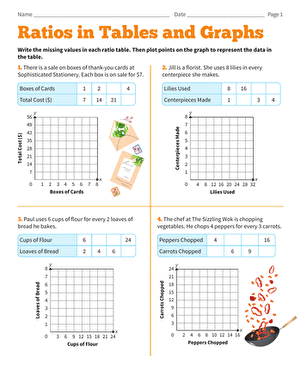
Here’s an example of a ratio table:
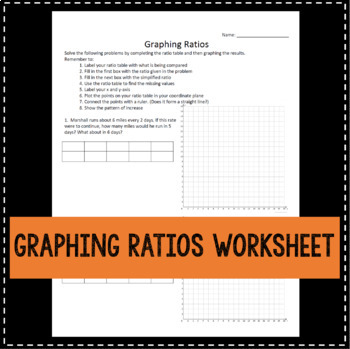
| Flour | Sugar |
|---|---|
| 2 | 3 |
| 4 | 6 |
| 6 | 9 |
| 8 | 12 |
3. Visualize with Graphs
Graphs are an excellent way to visualize the relationship between two quantities. To visualize a ratio table with a graph, follow these steps:
- Identify the variables: Determine the two variables that are related, such as flour and sugar.
- Plot the points: Plot the points on a coordinate plane, using the x-axis for one variable and the y-axis for the other.
- Draw the line: Draw a line through the points, making sure it passes through all the points.
Here’s an example of a graph:
 |
4. Apply Real-World Examples
Applying real-world examples is an excellent way to make ratio tables and graphs more meaningful and interesting. Here are a few examples:
- Cooking: Recipes often require specific ratios of ingredients. Use ratio tables and graphs to visualize the relationships between different ingredients.
- Architecture: Building designs often require specific ratios of dimensions. Use ratio tables and graphs to visualize the relationships between different dimensions.
- Finance: Financial ratios, such as debt-to-equity ratios, can be visualized using ratio tables and graphs.
5. Practice with Word Problems
Word problems are an excellent way to practice applying ratio tables and graphs to real-world scenarios. Here are a few examples:
- A recipe requires a ratio of 2:3 of flour to sugar. If you need to make 12 cups of sugar, how much flour do you need?
- A building design requires a ratio of 1:2 of width to length. If the width is 10 meters, what is the length?
- A financial ratio requires a ratio of 3:5 of debt to equity. If the debt is $3000, what is the equity?
To solve these word problems, follow these steps:
- Read the problem carefully: Understand the problem and identify the ratio.
- Create a ratio table: Create a ratio table to visualize the relationship between the two quantities.
- Use the table to solve the problem: Use the ratio table to solve the problem.
📝 Note: When solving word problems, make sure to read the problem carefully and identify the ratio. Use the ratio table to visualize the relationship between the two quantities, and then use the table to solve the problem.
In conclusion, mastering ratio tables and graphs requires practice, patience, and persistence. By following these five steps, you can develop a deep understanding of these concepts and apply them to real-world scenarios. Remember to practice creating ratio tables, visualize with graphs, apply real-world examples, and practice with word problems. With time and effort, you’ll become proficient in ratio tables and graphs, and you’ll be able to solve problems with confidence.
What is a ratio table?
+A ratio table is a table that shows the relationship between two quantities, often represented by a ratio of equivalent values.
How do I create a ratio table?
+To create a ratio table, identify the ratio, create a table with two columns, and fill in the table with equivalent values.
What is a graph in mathematics?
+A graph is a visual representation of data, often used to show the relationship between two or more variables.
Related Terms:
- Graphing ratios worksheet
- Ratio tables worksheets
- Tables equations and graphs worksheets
- Equivalent ratios worksheet
- Graphing Proportions Worksheet
