5 Fun Picture Graph Worksheets for Kids
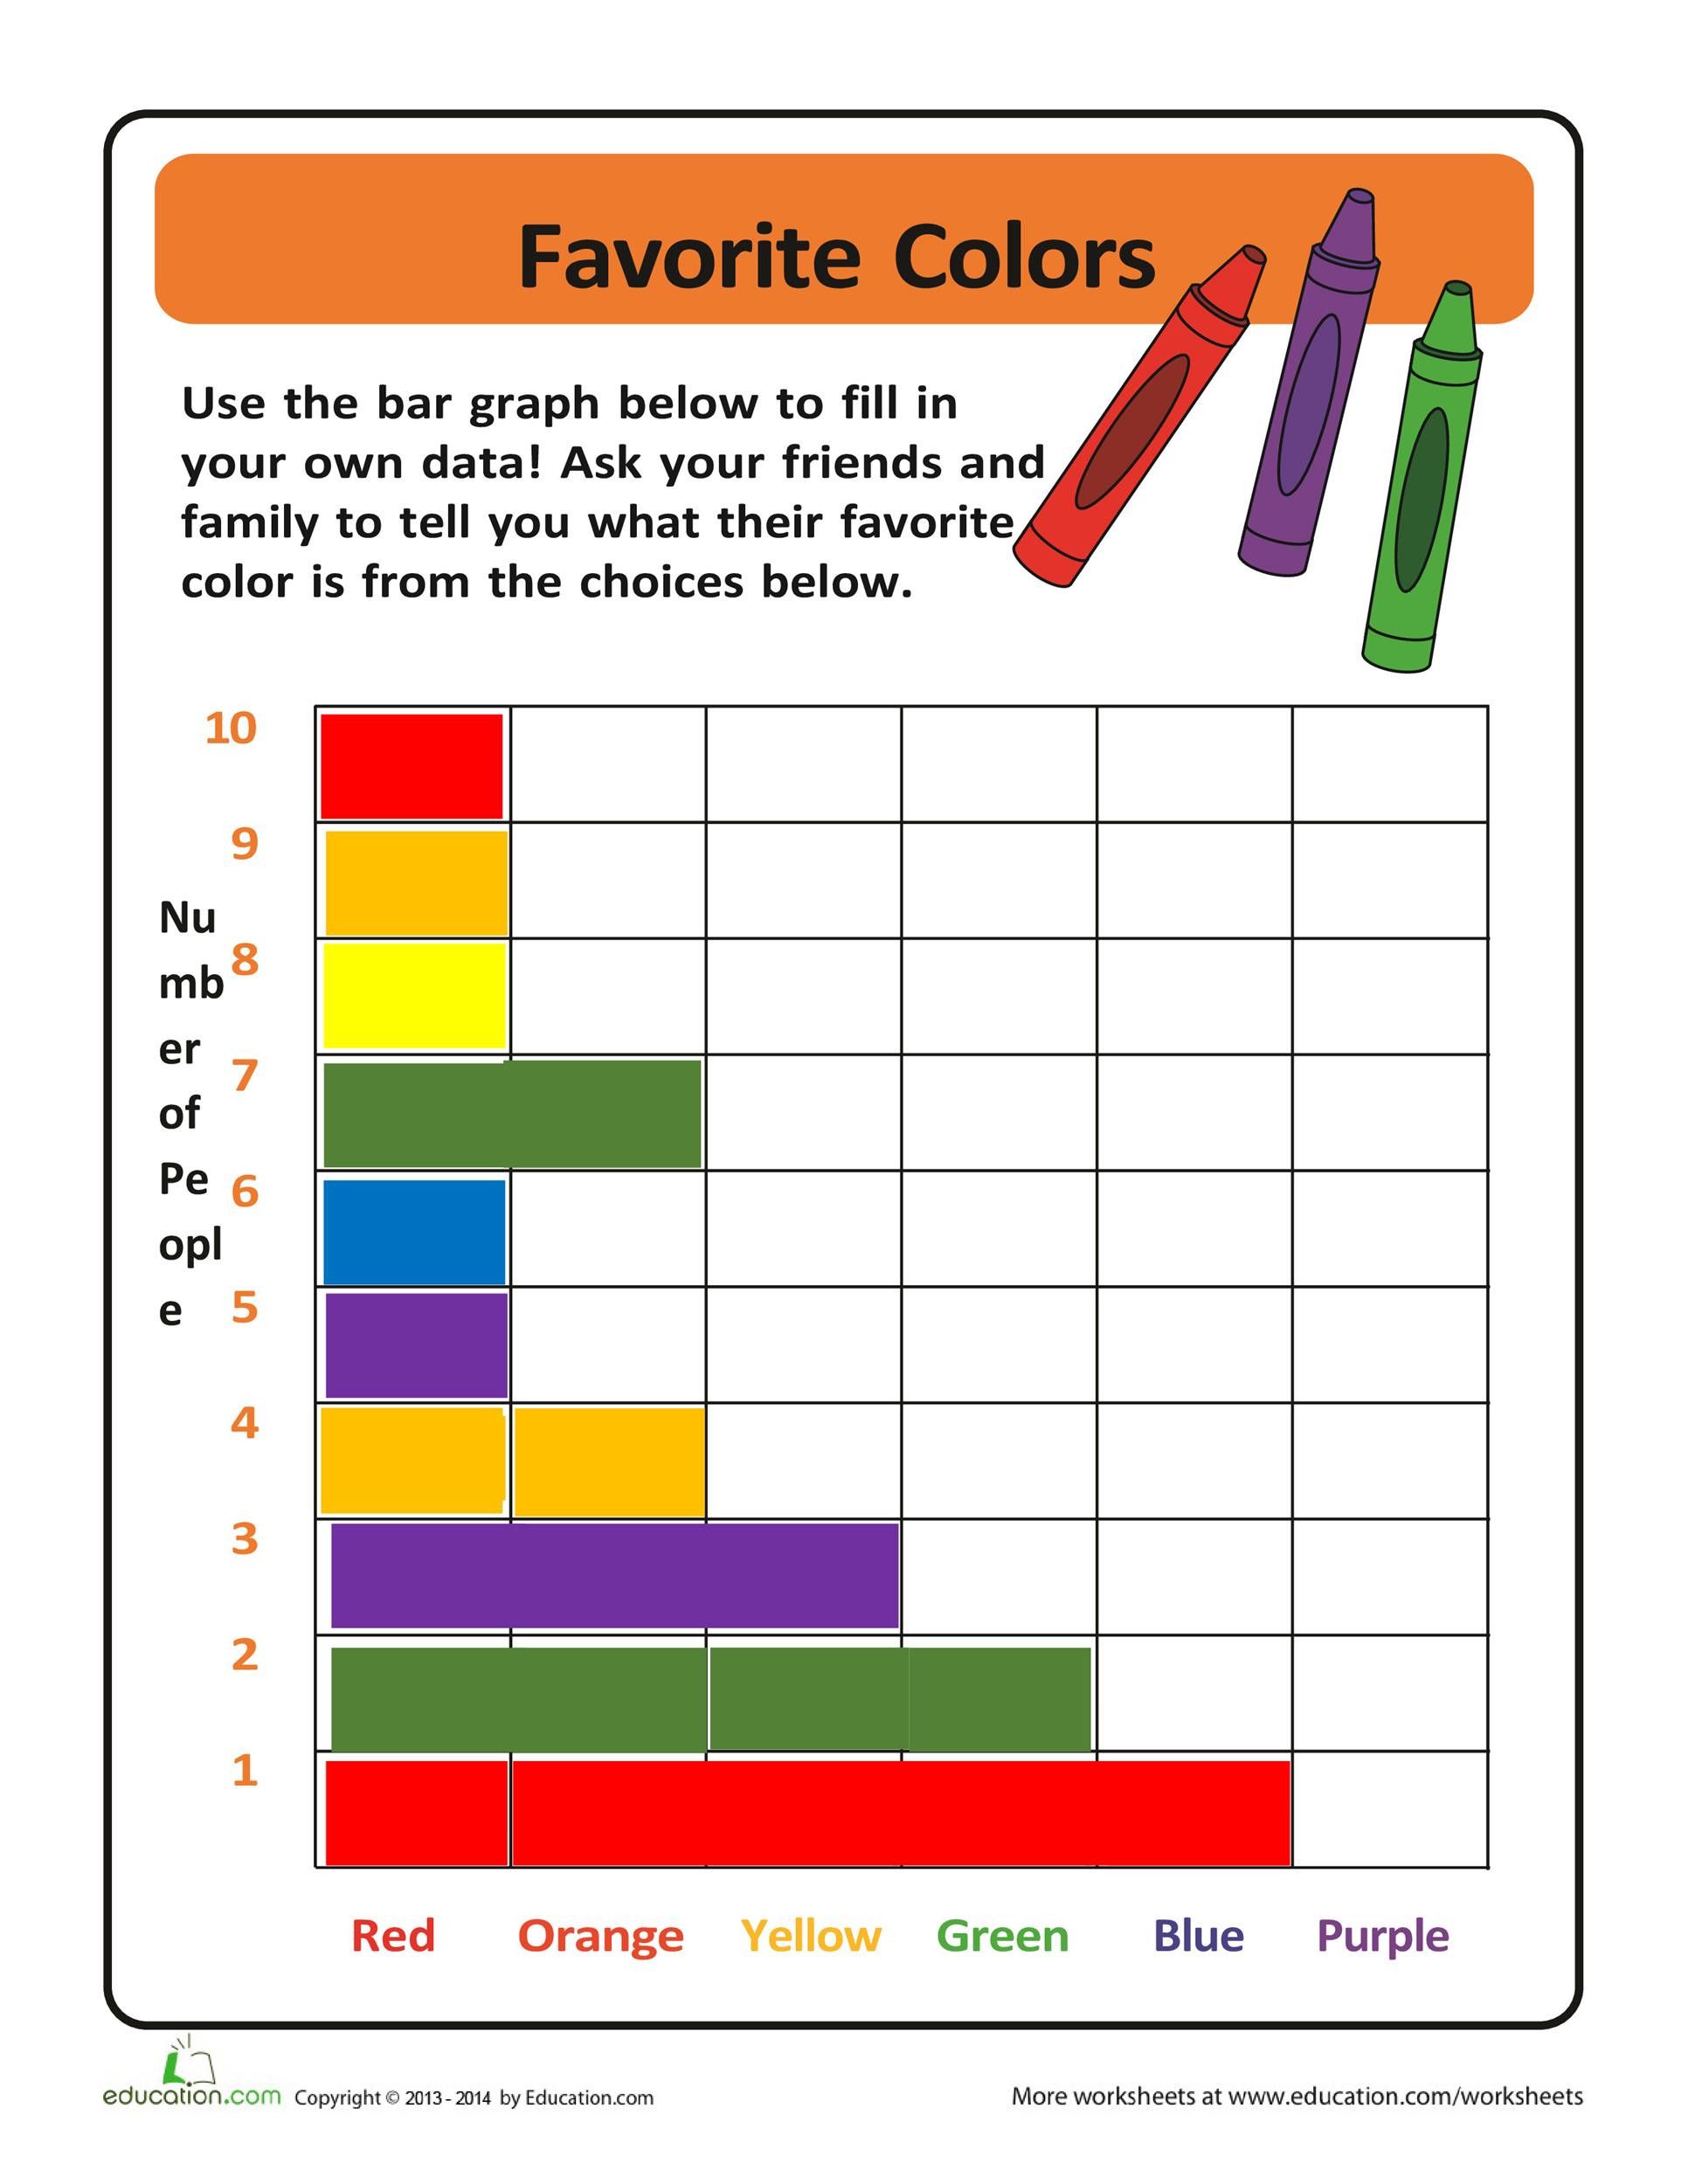
Exploring Picture Graphs with Fun and Interactive Worksheets for Kids
Picture graphs are a fantastic way to introduce young learners to the world of data analysis and visualization. They help kids understand how to collect, organize, and interpret data in a fun and engaging way. In this article, we will explore five fun picture graph worksheets that you can use to teach kids about this essential math concept.
What are Picture Graphs?
Picture graphs, also known as pictographs, are a type of graph that uses images or symbols to represent data. They are commonly used to display categorical data, such as favorite colors, pets, or sports teams. Picture graphs are an excellent way to help kids visualize data and make connections between different pieces of information.
Benefits of Using Picture Graphs for Kids
Using picture graphs with kids offers several benefits, including:
- Developing data analysis and interpretation skills
- Encouraging critical thinking and problem-solving
- Introducing basic math concepts, such as counting and categorization
- Enhancing visual literacy and communication skills
- Making learning fun and engaging!
5 Fun Picture Graph Worksheets for Kids
Here are five fun picture graph worksheets that you can use to teach kids about this exciting math concept:
Worksheet 1: Favorite Pets
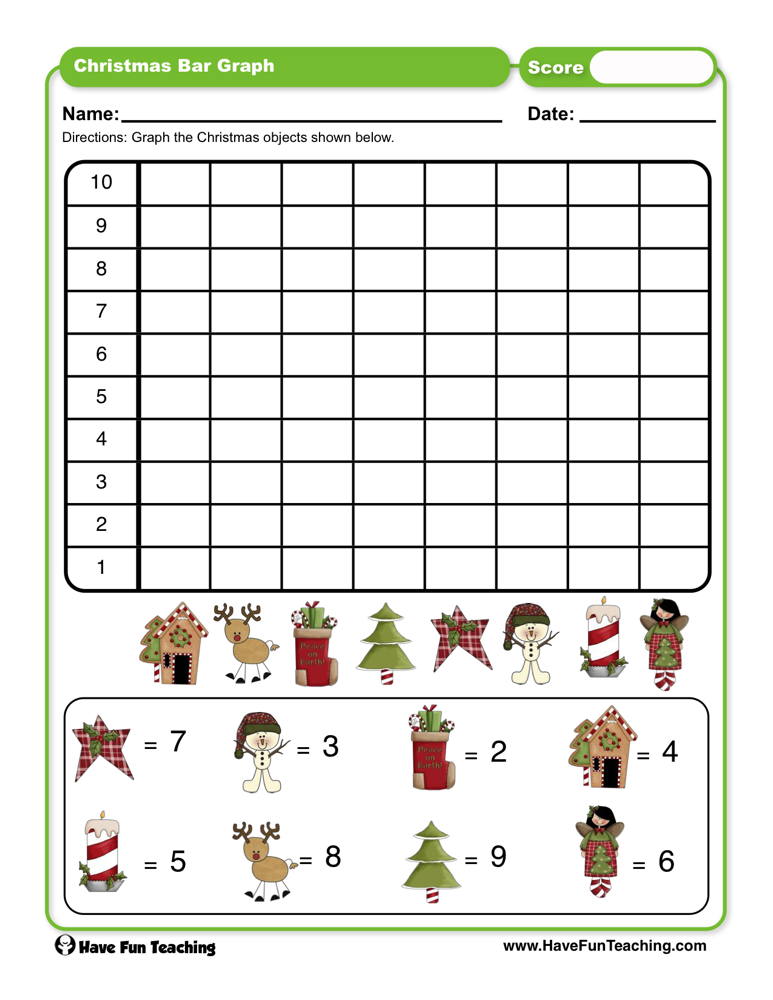
| Pet | Number of Students |
|---|---|
| Dog | 5 |
| Cat | 3 |
| Fish | 2 |
| Other | 1 |
In this worksheet, kids are asked to create a picture graph to show the favorite pets of their classmates. They can use images of dogs, cats, fish, and other animals to represent the data.
🐾 Note: Encourage kids to use different colors or symbols to represent each pet, and to include a key or legend to explain the graph.
Worksheet 2: Favorite Colors
| Color | Number of Students |
|---|---|
| Red | 4 |
| Blue | 5 |
| Green | 3 |
| Yellow | 2 |
In this worksheet, kids are asked to create a picture graph to show the favorite colors of their classmates. They can use colored blocks, crayons, or markers to represent the data.
🎨 Note: Encourage kids to use different shades or tints of each color to make the graph more visually appealing.
Worksheet 3: Favorite Sports
| Sport | Number of Students |
|---|---|
| Soccer | 6 |
| Basketball | 4 |
| Baseball | 3 |
| Other | 2 |
In this worksheet, kids are asked to create a picture graph to show the favorite sports of their classmates. They can use images of soccer balls, basketballs, baseballs, and other sports equipment to represent the data.
🏀 Note: Encourage kids to use different sizes or shapes to represent each sport, and to include a key or legend to explain the graph.
Worksheet 4: Favorite Foods
| Food | Number of Students |
|---|---|
| Pizza | 5 |
| Ice Cream | 4 |
| Chicken Nuggets | 3 |
| Other | 2 |
In this worksheet, kids are asked to create a picture graph to show the favorite foods of their classmates. They can use images of pizza, ice cream, chicken nuggets, and other food items to represent the data.
🍕 Note: Encourage kids to use different colors or patterns to represent each food, and to include a key or legend to explain the graph.
Worksheet 5: Favorite Season
| Season | Number of Students |
|---|---|
| Summer | 6 |
| Winter | 4 |
| Spring | 3 |
| Autumn | 2 |
In this worksheet, kids are asked to create a picture graph to show the favorite season of their classmates. They can use images of suns, snowflakes, flowers, and leaves to represent the data.
🌞 Note: Encourage kids to use different sizes or shapes to represent each season, and to include a key or legend to explain the graph.
To summarize, picture graphs are a fun and interactive way to teach kids about data analysis and visualization. The five worksheets presented in this article offer a range of exciting activities that can help kids develop their math skills and learn to create and interpret picture graphs.
What is a picture graph?
+A picture graph, also known as a pictograph, is a type of graph that uses images or symbols to represent data.
What are the benefits of using picture graphs for kids?
+Using picture graphs with kids offers several benefits, including developing data analysis and interpretation skills, encouraging critical thinking and problem-solving, and introducing basic math concepts.
How can I create a picture graph with my kids?
+You can create a picture graph with your kids by collecting data on a specific topic, such as favorite pets or colors, and then using images or symbols to represent the data.
