Find Slope in 5 Easy Ways from a Table

Understanding Slope and Its Importance
Slope is a fundamental concept in mathematics, particularly in algebra and geometry. It represents the ratio of the vertical change (rise) to the horizontal change (run) between two points on a line. The slope of a line can be positive, negative, zero, or undefined. A positive slope indicates a line that rises from left to right, a negative slope indicates a line that falls from left to right, a zero slope indicates a horizontal line, and an undefined slope indicates a vertical line.
Why Find Slope from a Table?
Finding the slope from a table is a crucial skill in mathematics, especially when working with real-world data. In many situations, data is presented in a tabular form, and we need to analyze the relationship between the variables. The slope of the line that best fits the data points can help us understand the rate of change, make predictions, and identify patterns.
Method 1: Using the Slope Formula
The slope formula is the most common method to find the slope from a table:
m = (y2 - y1) / (x2 - x1)
Where:
- m is the slope
- (x1, y1) and (x2, y2) are two points on the line
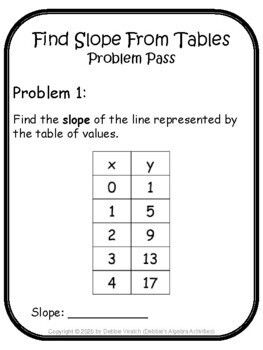
For example, let’s consider the following table:

| x | y |
|---|---|
| 2 | 3 |
| 4 | 5 |
| 6 | 7 |
To find the slope, we can choose any two points from the table. Let’s choose (2, 3) and (4, 5).
m = (5 - 3) / (4 - 2) = 2 / 2 = 1
Therefore, the slope is 1.
📝 Note: Make sure to choose two points that are not identical, as this will result in a division by zero error.
Method 2: Graphing the Points
Another way to find the slope from a table is to graph the points and visually identify the slope.
For example, let’s consider the same table as before:
| x | y |
|---|---|
| 2 | 3 |
| 4 | 5 |
| 6 | 7 |
By graphing the points on a coordinate plane, we can see that the line passes through the points (2, 3), (4, 5), and (6, 7).
From the graph, we can estimate the slope by drawing a line that best fits the points. In this case, the slope appears to be 1.
Method 3: Using a Slope Calculator
There are many online slope calculators available that can help you find the slope from a table. These calculators can save you time and reduce errors.
For example, let’s consider the same table as before:
| x | y |
|---|---|
| 2 | 3 |
| 4 | 5 |
| 6 | 7 |
By entering the points into a slope calculator, we can find the slope:
m = 1
Method 4: Finding the Rate of Change
The rate of change is another way to find the slope from a table. The rate of change is the ratio of the change in y to the change in x.
For example, let’s consider the same table as before:
| x | y |
|---|---|
| 2 | 3 |
| 4 | 5 |
| 6 | 7 |
To find the rate of change, we can calculate the change in y and the change in x between any two points.
Change in y = 5 - 3 = 2 Change in x = 4 - 2 = 2
Rate of change = change in y / change in x = 2 / 2 = 1
Therefore, the slope is 1.
Method 5: Using a Linear Regression
Linear regression is a statistical method that can help you find the slope from a table. This method is particularly useful when dealing with large datasets.
For example, let’s consider the same table as before:
| x | y |
|---|---|
| 2 | 3 |
| 4 | 5 |
| 6 | 7 |
By using a linear regression calculator or software, we can find the slope:
m = 1
In conclusion, finding the slope from a table can be done using various methods, including the slope formula, graphing the points, using a slope calculator, finding the rate of change, and using linear regression. Each method has its own advantages and disadvantages, and the choice of method depends on the specific situation and the level of precision required.
What is the slope formula?
+The slope formula is m = (y2 - y1) / (x2 - x1), where m is the slope and (x1, y1) and (x2, y2) are two points on the line.
How do I graph the points to find the slope?
+To graph the points, plot the x and y values on a coordinate plane. Then, draw a line that best fits the points. The slope can be estimated by looking at the steepness of the line.
What is linear regression?
+Linear regression is a statistical method that finds the best-fitting line to a set of data points. It can be used to find the slope of a line when dealing with large datasets.


