Graphing Basics for Science Students Made Easy

Understanding the Importance of Graphing in Science
Graphing is a fundamental tool in science, used to visualize and communicate data. As a science student, being able to create and interpret graphs is essential for analyzing and understanding complex data. In this article, we will cover the basics of graphing, including types of graphs, how to read and create graphs, and common mistakes to avoid.
Types of Graphs
There are several types of graphs used in science, each with its own unique characteristics and uses. Some of the most common types of graphs include:
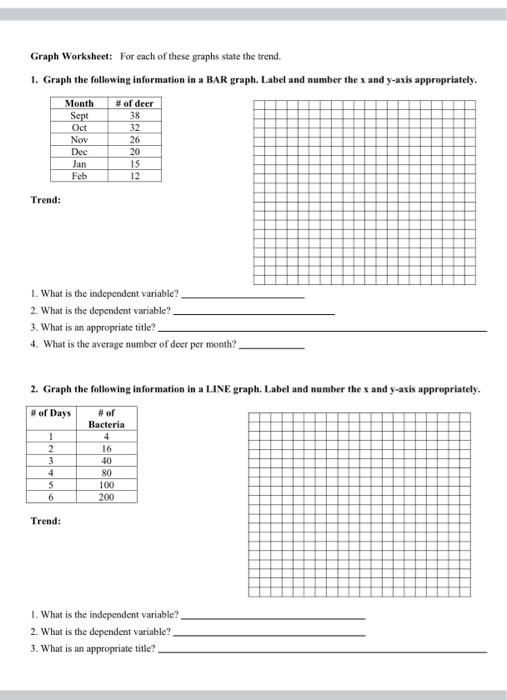
- Line Graphs: Used to show trends and patterns over time. They consist of a series of data points connected by lines.
- Bar Graphs: Used to compare categorical data. They consist of bars of different heights or lengths to represent the data.
- Histograms: Used to show the distribution of continuous data. They consist of bars of different widths and heights to represent the data.
- Scatter Plots: Used to show the relationship between two variables. They consist of a series of data points plotted on a grid.
Reading Graphs
To effectively read a graph, you need to understand the components of a graph and what they represent.
- Title: The title of the graph should clearly indicate what the graph is showing.
- Axes: The x-axis and y-axis should be labeled with the variables being measured.
- Scale: The scale of the graph should be consistent and easy to read.
- Data Points: The data points on the graph should be clearly marked and easy to read.
Creating Graphs
Creating a graph involves several steps:
- Choose the type of graph: Select the type of graph that best represents the data.
- Label the axes: Label the x-axis and y-axis with the variables being measured.
- Determine the scale: Determine the scale of the graph and ensure it is consistent.
- Plot the data points: Plot the data points on the graph.
- Add a title: Add a title to the graph that clearly indicates what the graph is showing.
📝 Note: When creating a graph, it's essential to ensure that the scale is consistent and easy to read. This will help to avoid misinterpretation of the data.
Common Mistakes to Avoid
When creating and reading graphs, there are several common mistakes to avoid:
- Inconsistent scale: An inconsistent scale can make the graph difficult to read and interpret.
- Incorrect labeling: Incorrect labeling of the axes or data points can lead to misinterpretation of the data.
- Insufficient data: Insufficient data can make it difficult to draw conclusions from the graph.
- Incorrect graph type: Using the wrong type of graph can make it difficult to accurately represent the data.
Best Practices for Graphing
To ensure that your graphs are clear and effective, follow these best practices:
- Use clear and concise labels: Use clear and concise labels for the axes and data points.
- Use a consistent scale: Use a consistent scale for the graph.
- Use the correct graph type: Use the correct graph type for the data.
- Keep it simple: Avoid cluttering the graph with too much information.
Real-World Applications of Graphing
Graphing has numerous real-world applications in science, including:
- Data analysis: Graphing is used to analyze and interpret complex data in various fields of science.
- Research: Graphing is used to present and communicate research findings.
- Education: Graphing is used to teach and learn scientific concepts.
Conclusion
Graphing is a fundamental tool in science, used to visualize and communicate data. By understanding the basics of graphing, including types of graphs, how to read and create graphs, and common mistakes to avoid, science students can effectively analyze and interpret complex data. Remember to follow best practices for graphing and use graphing to present and communicate research findings.
What is the purpose of graphing in science?
+Graphing is used to visualize and communicate data in science, allowing scientists to analyze and interpret complex data.
What are the different types of graphs used in science?
+The different types of graphs used in science include line graphs, bar graphs, histograms, and scatter plots.
What are some common mistakes to avoid when creating a graph?
+Common mistakes to avoid when creating a graph include using an inconsistent scale, incorrect labeling, insufficient data, and using the wrong graph type.
Related Terms:
- Science Graphing worksheets PDF
- Interpreting science graphs worksheet PDF
- Science graphing practice worksheet
- Graphing in science
- Introduction to Graphing worksheet pdf


