Stem and Leaf Plot Worksheet: A Math Visualization Tool

Understanding the Concept of Stem and Leaf Plots
Stem and leaf plots are a type of mathematical visualization tool used to display the distribution of a dataset. They are particularly useful for understanding the shape of a dataset, identifying patterns, and comparing the distribution of different datasets. In this blog post, we will delve into the world of stem and leaf plots, explore their benefits, and provide a comprehensive worksheet to help you practice creating and interpreting these plots.
What is a Stem and Leaf Plot?
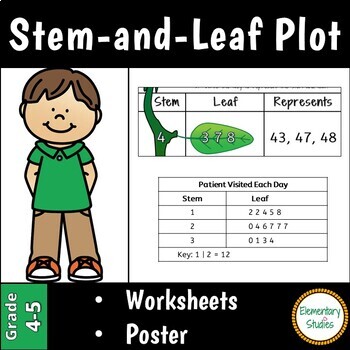
A stem and leaf plot is a graphical representation of a dataset that displays the data points in a way that allows for easy comparison and analysis. The plot consists of two parts: the stem and the leaf. The stem represents the first digit or digits of each data point, while the leaf represents the remaining digits.
For example, consider the dataset: 12, 14, 15, 18, 20, 22, 25, 27, 30, 32. A stem and leaf plot for this dataset would be:
1 | 2, 4, 5, 8
2 | 0, 2, 5, 7
3 | 0, 2
In this plot, the numbers in the left column (1, 2, 3) are the stems, and the numbers in the right column (2, 4, 5, 8, etc.) are the leaves.
Benefits of Using Stem and Leaf Plots
Stem and leaf plots offer several benefits, including:
- Easy to create: Stem and leaf plots are simple to create, especially when compared to other types of plots like histograms or box plots.
- Quick visualization: Stem and leaf plots provide a quick and easy way to visualize the distribution of a dataset.
- Comparisons: Stem and leaf plots make it easy to compare the distribution of different datasets.
- Patterns: Stem and leaf plots can help identify patterns in a dataset, such as skewness or outliers.
How to Create a Stem and Leaf Plot
Creating a stem and leaf plot is a straightforward process. Here are the steps:
- Sort the data: Sort the dataset in ascending order.
- Identify the stem: Identify the first digit or digits of each data point, which will serve as the stem.
- Identify the leaf: Identify the remaining digits of each data point, which will serve as the leaf.
- Create the plot: Create the plot by listing the stems in the left column and the corresponding leaves in the right column.
📝 Note: When creating a stem and leaf plot, make sure to use the correct number of digits for the stem and leaf. For example, if the dataset contains numbers with two digits, use two digits for the stem and leaf.
Stem and Leaf Plot Worksheet
Here is a worksheet with several exercises to help you practice creating and interpreting stem and leaf plots:
Exercise 1
Create a stem and leaf plot for the following dataset: 23, 11, 18, 25, 22, 15, 20, 28, 32, 19
Exercise 2
Create a stem and leaf plot for the following dataset: 45, 67, 23, 11, 56, 78, 34, 89, 12, 65
Exercise 3
Compare the distribution of the two datasets from Exercises 1 and 2. How are they similar? How are they different?
Exercise 4
Create a stem and leaf plot for the following dataset: 123, 145, 167, 189, 201, 223, 245, 267, 289, 311
Exercise 5
Identify any patterns or outliers in the dataset from Exercise 4.
📝 Note: Remember to use the correct number of digits for the stem and leaf when creating the plot.
Conclusion
Stem and leaf plots are a powerful tool for visualizing and analyzing datasets. By following the steps outlined in this blog post, you can create and interpret stem and leaf plots with ease. Remember to practice regularly to become proficient in using this tool.
What is the purpose of a stem and leaf plot?
+The purpose of a stem and leaf plot is to display the distribution of a dataset in a way that allows for easy comparison and analysis.
How do I create a stem and leaf plot?
+To create a stem and leaf plot, sort the data, identify the stem and leaf, and create the plot by listing the stems in the left column and the corresponding leaves in the right column.
What are the benefits of using stem and leaf plots?
+The benefits of using stem and leaf plots include ease of creation, quick visualization, comparisons, and pattern identification.


