7 Ways to Master Normal Distributions

Understanding Normal Distributions
Normal distributions, also known as Gaussian distributions or bell curves, are a fundamental concept in statistics and data analysis. They describe how data points are spread out from the mean value, with the majority of data points clustering around the average and tapering off gradually towards the extremes. Mastering normal distributions is essential for anyone working with data, as it enables you to understand and analyze complex data sets, make informed decisions, and communicate insights effectively.
Why Normal Distributions Matter
Normal distributions are ubiquitous in nature and human-made systems. They appear in various forms, from the heights of individuals in a population to the errors in measurement instruments. Understanding normal distributions helps you:
- Model real-world phenomena: Normal distributions can be used to model a wide range of real-world phenomena, such as stock prices, IQ scores, and measurement errors.
- Make predictions: By understanding how data points are distributed, you can make predictions about future outcomes and estimate probabilities.
- Analyze and visualize data: Normal distributions provide a framework for analyzing and visualizing data, making it easier to identify patterns, trends, and correlations.
Key Characteristics of Normal Distributions
To master normal distributions, you need to understand their key characteristics:
- Symmetry: Normal distributions are symmetrical around the mean, with the left and right sides of the curve being mirror images of each other.
- Bell-shaped: Normal distributions have a bell-shaped curve, with the majority of data points clustering around the mean.
- Mean, median, and mode: The mean, median, and mode of a normal distribution are all equal.
- Standard deviation: The standard deviation measures the spread of the data points from the mean.
7 Ways to Master Normal Distributions
Now that you understand the importance and key characteristics of normal distributions, here are 7 ways to master them:
1. Learn the 68-95-99.7 Rule
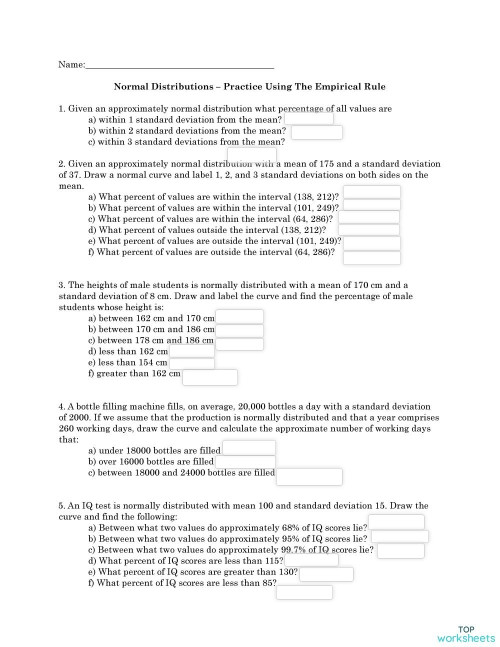
The 68-95-99.7 rule, also known as the empirical rule, states that:
- 68% of data points fall within 1 standard deviation of the mean.
- 95% of data points fall within 2 standard deviations of the mean.
- 99.7% of data points fall within 3 standard deviations of the mean.
This rule provides a simple way to estimate the percentage of data points that fall within a certain range.
2. Understand Z-Scores
Z-scores measure how many standard deviations a data point is away from the mean. A z-score can be calculated using the following formula:
z = (X - μ) / σ
where X is the data point, μ is the mean, and σ is the standard deviation.
Z-scores are essential for comparing data points from different normal distributions.
3. Learn to Calculate Probabilities
To calculate probabilities, you need to understand how to use the standard normal distribution (Z-table). The Z-table provides the probability that a data point falls within a certain range.
For example, to calculate the probability that a data point falls within 2 standard deviations of the mean, you can look up the z-score in the Z-table.
4. Practice Visualizing Normal Distributions
Visualizing normal distributions is essential for understanding how data points are spread out. You can use histograms, box plots, or density plots to visualize normal distributions.
5. Learn to Identify Non-Normal Distributions
Not all data sets follow a normal distribution. It’s essential to learn how to identify non-normal distributions, such as skewed or bimodal distributions.
6. Understand the Central Limit Theorem
The Central Limit Theorem (CLT) states that the distribution of sample means will be approximately normal, even if the underlying population distribution is not normal.
The CLT is essential for making inferences about populations based on sample data.
7. Use Real-World Examples
Using real-world examples is an effective way to master normal distributions. Try to find examples of normal distributions in your everyday life, such as:
- Stock prices: Stock prices often follow a normal distribution, with prices clustering around the mean.
- IQ scores: IQ scores follow a normal distribution, with most people having average IQ scores.
📝 Note: Practice is key to mastering normal distributions. Try to work on as many examples as possible to reinforce your understanding.
In conclusion, mastering normal distributions requires a deep understanding of their key characteristics, as well as practice and application. By following these 7 ways to master normal distributions, you’ll be well on your way to becoming a proficient data analyst.
What is the main characteristic of a normal distribution?
+
A normal distribution is symmetrical around the mean, with the left and right sides of the curve being mirror images of each other.
What is the 68-95-99.7 rule?
+
The 68-95-99.7 rule states that 68% of data points fall within 1 standard deviation of the mean, 95% of data points fall within 2 standard deviations of the mean, and 99.7% of data points fall within 3 standard deviations of the mean.
What is the Central Limit Theorem?
+
The Central Limit Theorem states that the distribution of sample means will be approximately normal, even if the underlying population distribution is not normal.
Related Terms:
- Normal distribution Worksheet PDF
- Normal distribution Worksheet doc
- Normal distribution Worksheet Kuta
- Normal distribution PDF
- Empirical Rule Worksheet pdf
- Problem set 12 7


