H-R Diagram Worksheet Answers and Solutions Explained

Understanding the H-R Diagram: A Comprehensive Guide
The Hertzsprung-Russell (H-R) diagram is a fundamental tool in astronomy, used to understand the nature and evolution of stars. It is a graphical representation of the relationship between a star’s luminosity (or brightness) and its surface temperature. In this article, we will delve into the world of H-R diagrams, exploring their significance, components, and how to interpret them.
What is an H-R Diagram?
An H-R diagram is a plot of a star’s luminosity (vertical axis) against its surface temperature (horizontal axis). The diagram is named after the Danish astronomer Ejnar Hertzsprung and the American astronomer Henry Norris Russell, who independently developed the concept in the early 20th century. The H-R diagram is a powerful tool for understanding the life cycles of stars, from their birth to their eventual death.
Components of an H-R Diagram
An H-R diagram consists of several key components:
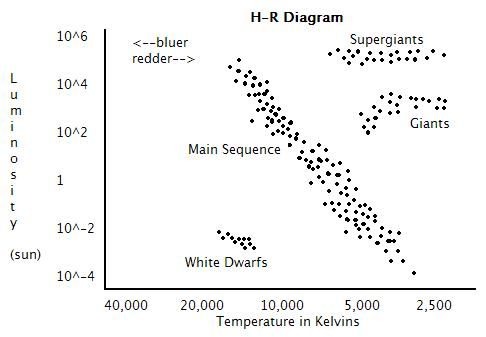
- Main Sequence: This is the diagonal line that runs from the top left to the bottom right of the diagram. The main sequence represents the stage at which stars like our Sun spend most of their lives, fusing hydrogen into helium in their cores.
- Red Giants: These are stars that have exhausted their hydrogen fuel and have expanded to become much larger and cooler. Red giants are located above the main sequence on the H-R diagram.
- White Dwarfs: These are small, hot stars that are the remnants of stars that have exhausted their fuel and have shed their outer layers. White dwarfs are located below the main sequence on the H-R diagram.
- Neutron Stars and Black Holes: These are the extremely dense remnants of massive stars that have undergone a supernova explosion. They are not typically shown on an H-R diagram.
How to Interpret an H-R Diagram
Interpreting an H-R diagram requires understanding the relationships between luminosity, temperature, and the life stages of stars. Here are some key points to keep in mind:
- Luminosity: The vertical axis of the H-R diagram represents a star’s luminosity, or brightness. More luminous stars are located higher on the diagram.
- Temperature: The horizontal axis represents a star’s surface temperature. Hotter stars are located to the left on the diagram, while cooler stars are located to the right.
- Life Stages: The H-R diagram can be used to identify the life stages of stars. Main sequence stars are in the middle of their lives, while red giants are nearing the end of their lives. White dwarfs are the remnants of dead stars.
Worksheet Answers and Solutions
Here are some sample worksheet questions and answers to help you understand how to interpret an H-R diagram:
Question 1: What is the main sequence on an H-R diagram?
Answer: The main sequence is the diagonal line that runs from the top left to the bottom right of the diagram, representing the stage at which stars like our Sun spend most of their lives.
Question 2: What is the difference between a red giant and a white dwarf?
Answer: A red giant is a star that has exhausted its hydrogen fuel and has expanded to become much larger and cooler, while a white dwarf is a small, hot star that is the remnant of a star that has exhausted its fuel and has shed its outer layers.
Question 3: Where are neutron stars and black holes located on an H-R diagram?
Answer: Neutron stars and black holes are not typically shown on an H-R diagram, as they are extremely dense remnants of massive stars that have undergone a supernova explosion.
📝 Note: The H-R diagram is a fundamental tool in astronomy, and understanding its components and how to interpret it is essential for understanding the life cycles of stars.
Conclusion
In conclusion, the H-R diagram is a powerful tool for understanding the nature and evolution of stars. By understanding the components of the diagram and how to interpret it, you can gain insights into the life stages of stars and the relationships between luminosity, temperature, and the life stages of stars.
What is the main sequence on an H-R diagram?
+The main sequence is the diagonal line that runs from the top left to the bottom right of the diagram, representing the stage at which stars like our Sun spend most of their lives.
What is the difference between a red giant and a white dwarf?
+A red giant is a star that has exhausted its hydrogen fuel and has expanded to become much larger and cooler, while a white dwarf is a small, hot star that is the remnant of a star that has exhausted its fuel and has shed its outer layers.
Where are neutron stars and black holes located on an H-R diagram?
+Neutron stars and black holes are not typically shown on an H-R diagram, as they are extremely dense remnants of massive stars that have undergone a supernova explosion.


