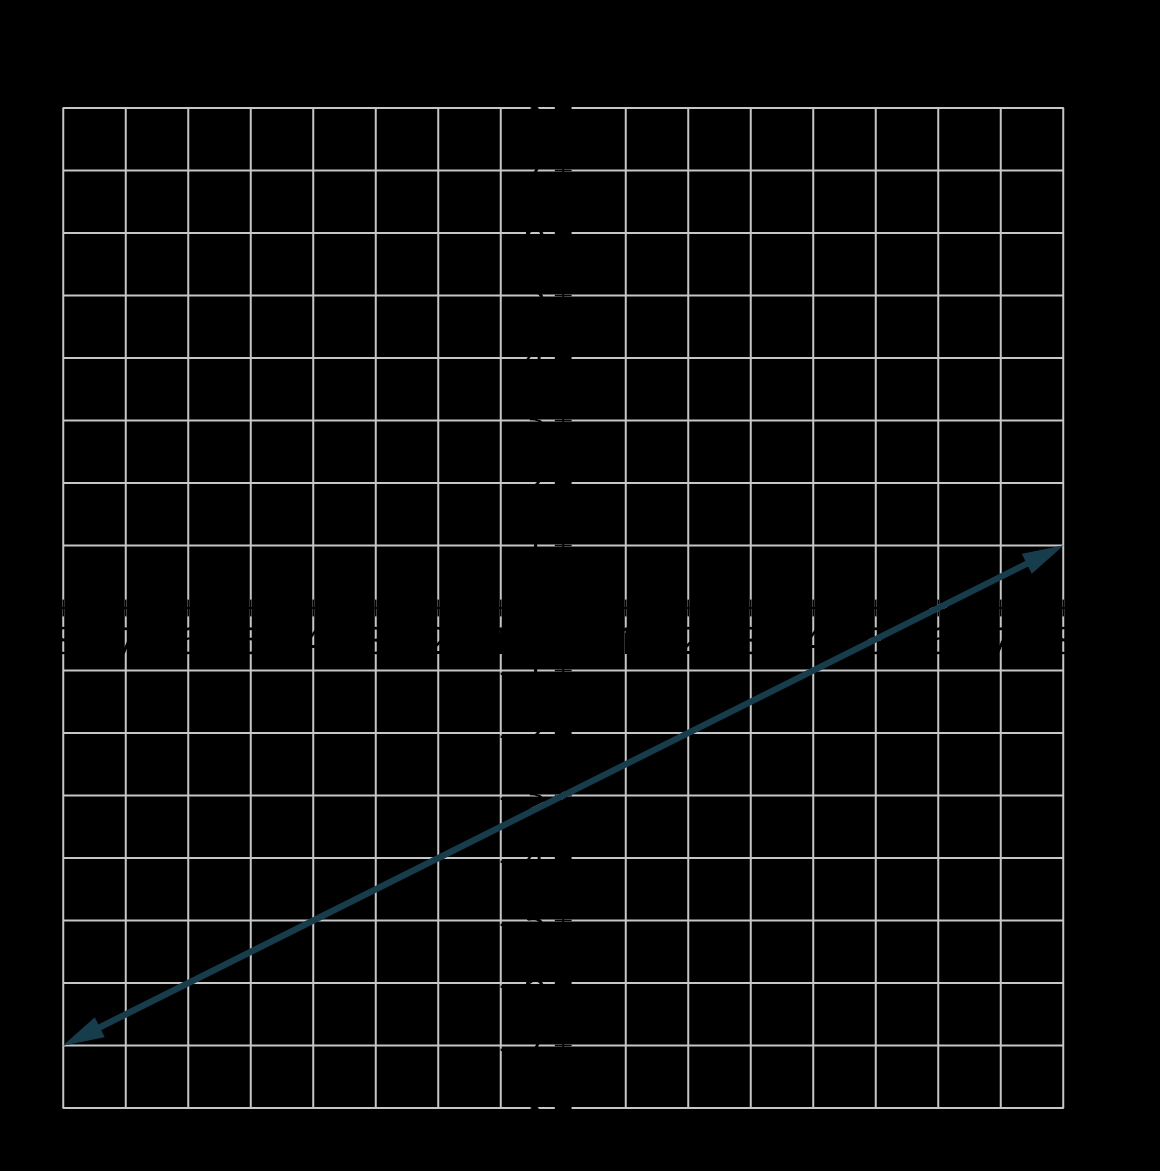
Graphing Linear Functions Made Easy

Understanding Linear Functions
Linear functions are a fundamental concept in mathematics, and graphing them is a crucial skill for any student to master. A linear function is a polynomial function of degree one, which means the highest power of the variable (usually x) is one. Linear functions can be represented in the form of f(x) = mx + b, where m is the slope of the line and b is the y-intercept.
Key Components of a Linear Function
Before we dive into graphing linear functions, it’s essential to understand the key components that make up the equation.
- Slope (m): The slope of a linear function represents the rate of change of the output variable (y) with respect to the input variable (x). A positive slope indicates a direct relationship between x and y, while a negative slope indicates an inverse relationship.
- Y-intercept (b): The y-intercept is the point where the line crosses the y-axis. It represents the value of y when x is equal to zero.
Graphing Linear Functions
Now that we’ve covered the basics of linear functions, let’s move on to graphing them. There are several ways to graph linear functions, but we’ll focus on the most common method: using the slope-intercept form.
Step 1: Write the equation in slope-intercept form
To graph a linear function, start by writing the equation in slope-intercept form: f(x) = mx + b. If the equation is not in this form, you can rearrange it to isolate y.
Step 2: Plot the y-intercept
The y-intercept is the point where the line crosses the y-axis. To plot the y-intercept, find the value of b in the equation and mark the corresponding point on the y-axis.
Step 3: Use the slope to plot additional points
Once you’ve plotted the y-intercept, use the slope to plot additional points on the line. The slope will tell you how much to increase or decrease the y-coordinate for each unit increase in the x-coordinate.
- Positive slope: If the slope is positive, move up and to the right from the y-intercept.
- Negative slope: If the slope is negative, move down and to the right from the y-intercept.
Step 4: Draw the line
After plotting several points, draw a straight line through them to represent the linear function.
📝 Note: Make sure to label the x and y axes and include a title for the graph.
Example
Let’s graph the linear function f(x) = 2x + 3.
- Step 1: Write the equation in slope-intercept form: f(x) = 2x + 3.
- Step 2: Plot the y-intercept: b = 3, so the point is (0, 3).
- Step 3: Use the slope to plot additional points:
- Since the slope is positive (m = 2), move up and to the right from the y-intercept.
- For every unit increase in x, increase y by 2.
- Step 4: Draw the line.
The resulting graph will be a straight line with a positive slope.
Special Cases: Horizontal and Vertical Lines
There are two special cases to consider when graphing linear functions: horizontal and vertical lines.
- Horizontal lines: A horizontal line has a slope of zero (m = 0). In this case, the line will be parallel to the x-axis, and the y-coordinate will be constant.
- Vertical lines: A vertical line has an undefined slope (m is undefined). In this case, the line will be parallel to the y-axis, and the x-coordinate will be constant.
Conclusion
Graphing linear functions is a fundamental skill in mathematics, and by following these steps, you can easily graph any linear function. Remember to write the equation in slope-intercept form, plot the y-intercept, use the slope to plot additional points, and draw the line. With practice, you’ll become proficient in graphing linear functions and be ready to tackle more complex mathematical concepts.
What is the slope-intercept form of a linear function?
+The slope-intercept form of a linear function is f(x) = mx + b, where m is the slope and b is the y-intercept.
How do I plot the y-intercept of a linear function?
+To plot the y-intercept, find the value of b in the equation and mark the corresponding point on the y-axis.
What is the difference between a horizontal and vertical line?
+A horizontal line has a slope of zero (m = 0) and is parallel to the x-axis, while a vertical line has an undefined slope (m is undefined) and is parallel to the y-axis.


