5 Ways to Master Graphing Coordinate Plane Worksheets

Unlocking the Secrets of Graphing Coordinate Plane Worksheets
Graphing coordinate plane worksheets can be a daunting task for many students, but with the right strategies and techniques, mastering them can be a breeze. In this article, we will explore five ways to help you become a pro at graphing coordinate plane worksheets.
1. Understanding the Basics
Before diving into graphing, it’s essential to understand the basics of the coordinate plane. The coordinate plane is a two-dimensional grid with x and y axes that intersect at the origin (0,0). Each point on the plane is represented by an ordered pair of coordinates (x,y).
Key Concepts:
- X-axis: The horizontal axis that runs from left to right, with positive numbers on the right and negative numbers on the left.
- Y-axis: The vertical axis that runs from bottom to top, with positive numbers on top and negative numbers on the bottom.
- Origin: The point where the x and y axes intersect, represented by (0,0).
- Quadrants: The four regions of the coordinate plane: I (top-right), II (top-left), III (bottom-left), and IV (bottom-right).
2. Plotting Points
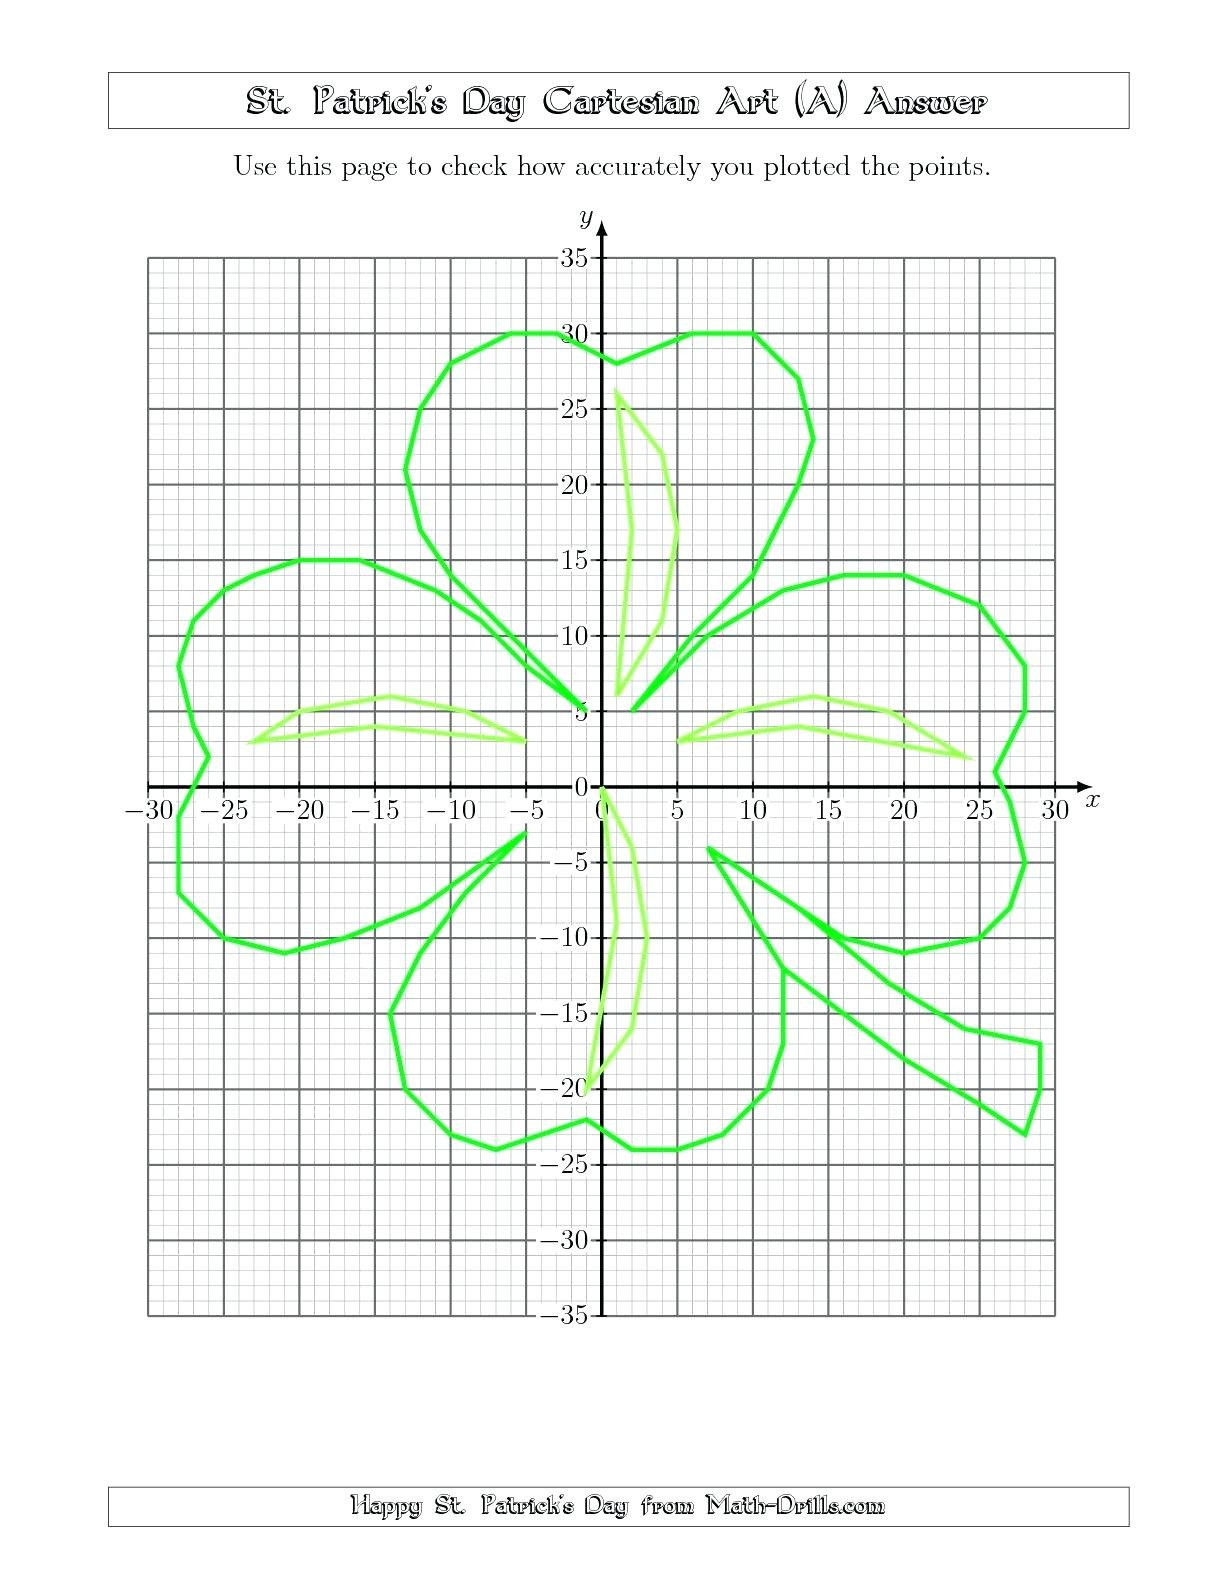
Plotting points is the foundation of graphing. To plot a point, start by identifying the x-coordinate (the number on the x-axis) and the y-coordinate (the number on the y-axis). Then, move horizontally to the x-coordinate and vertically to the y-coordinate.
Tips:
- Use a ruler or straightedge: To ensure accuracy, use a ruler or straightedge to draw a line from the x-axis to the point and from the y-axis to the point.
- Label points: Label each point with its coordinates (x,y) to avoid confusion.
- Check quadrants: Make sure to check the quadrant of each point to ensure accurate plotting.
3. Identifying Graph Types
There are several types of graphs, including:
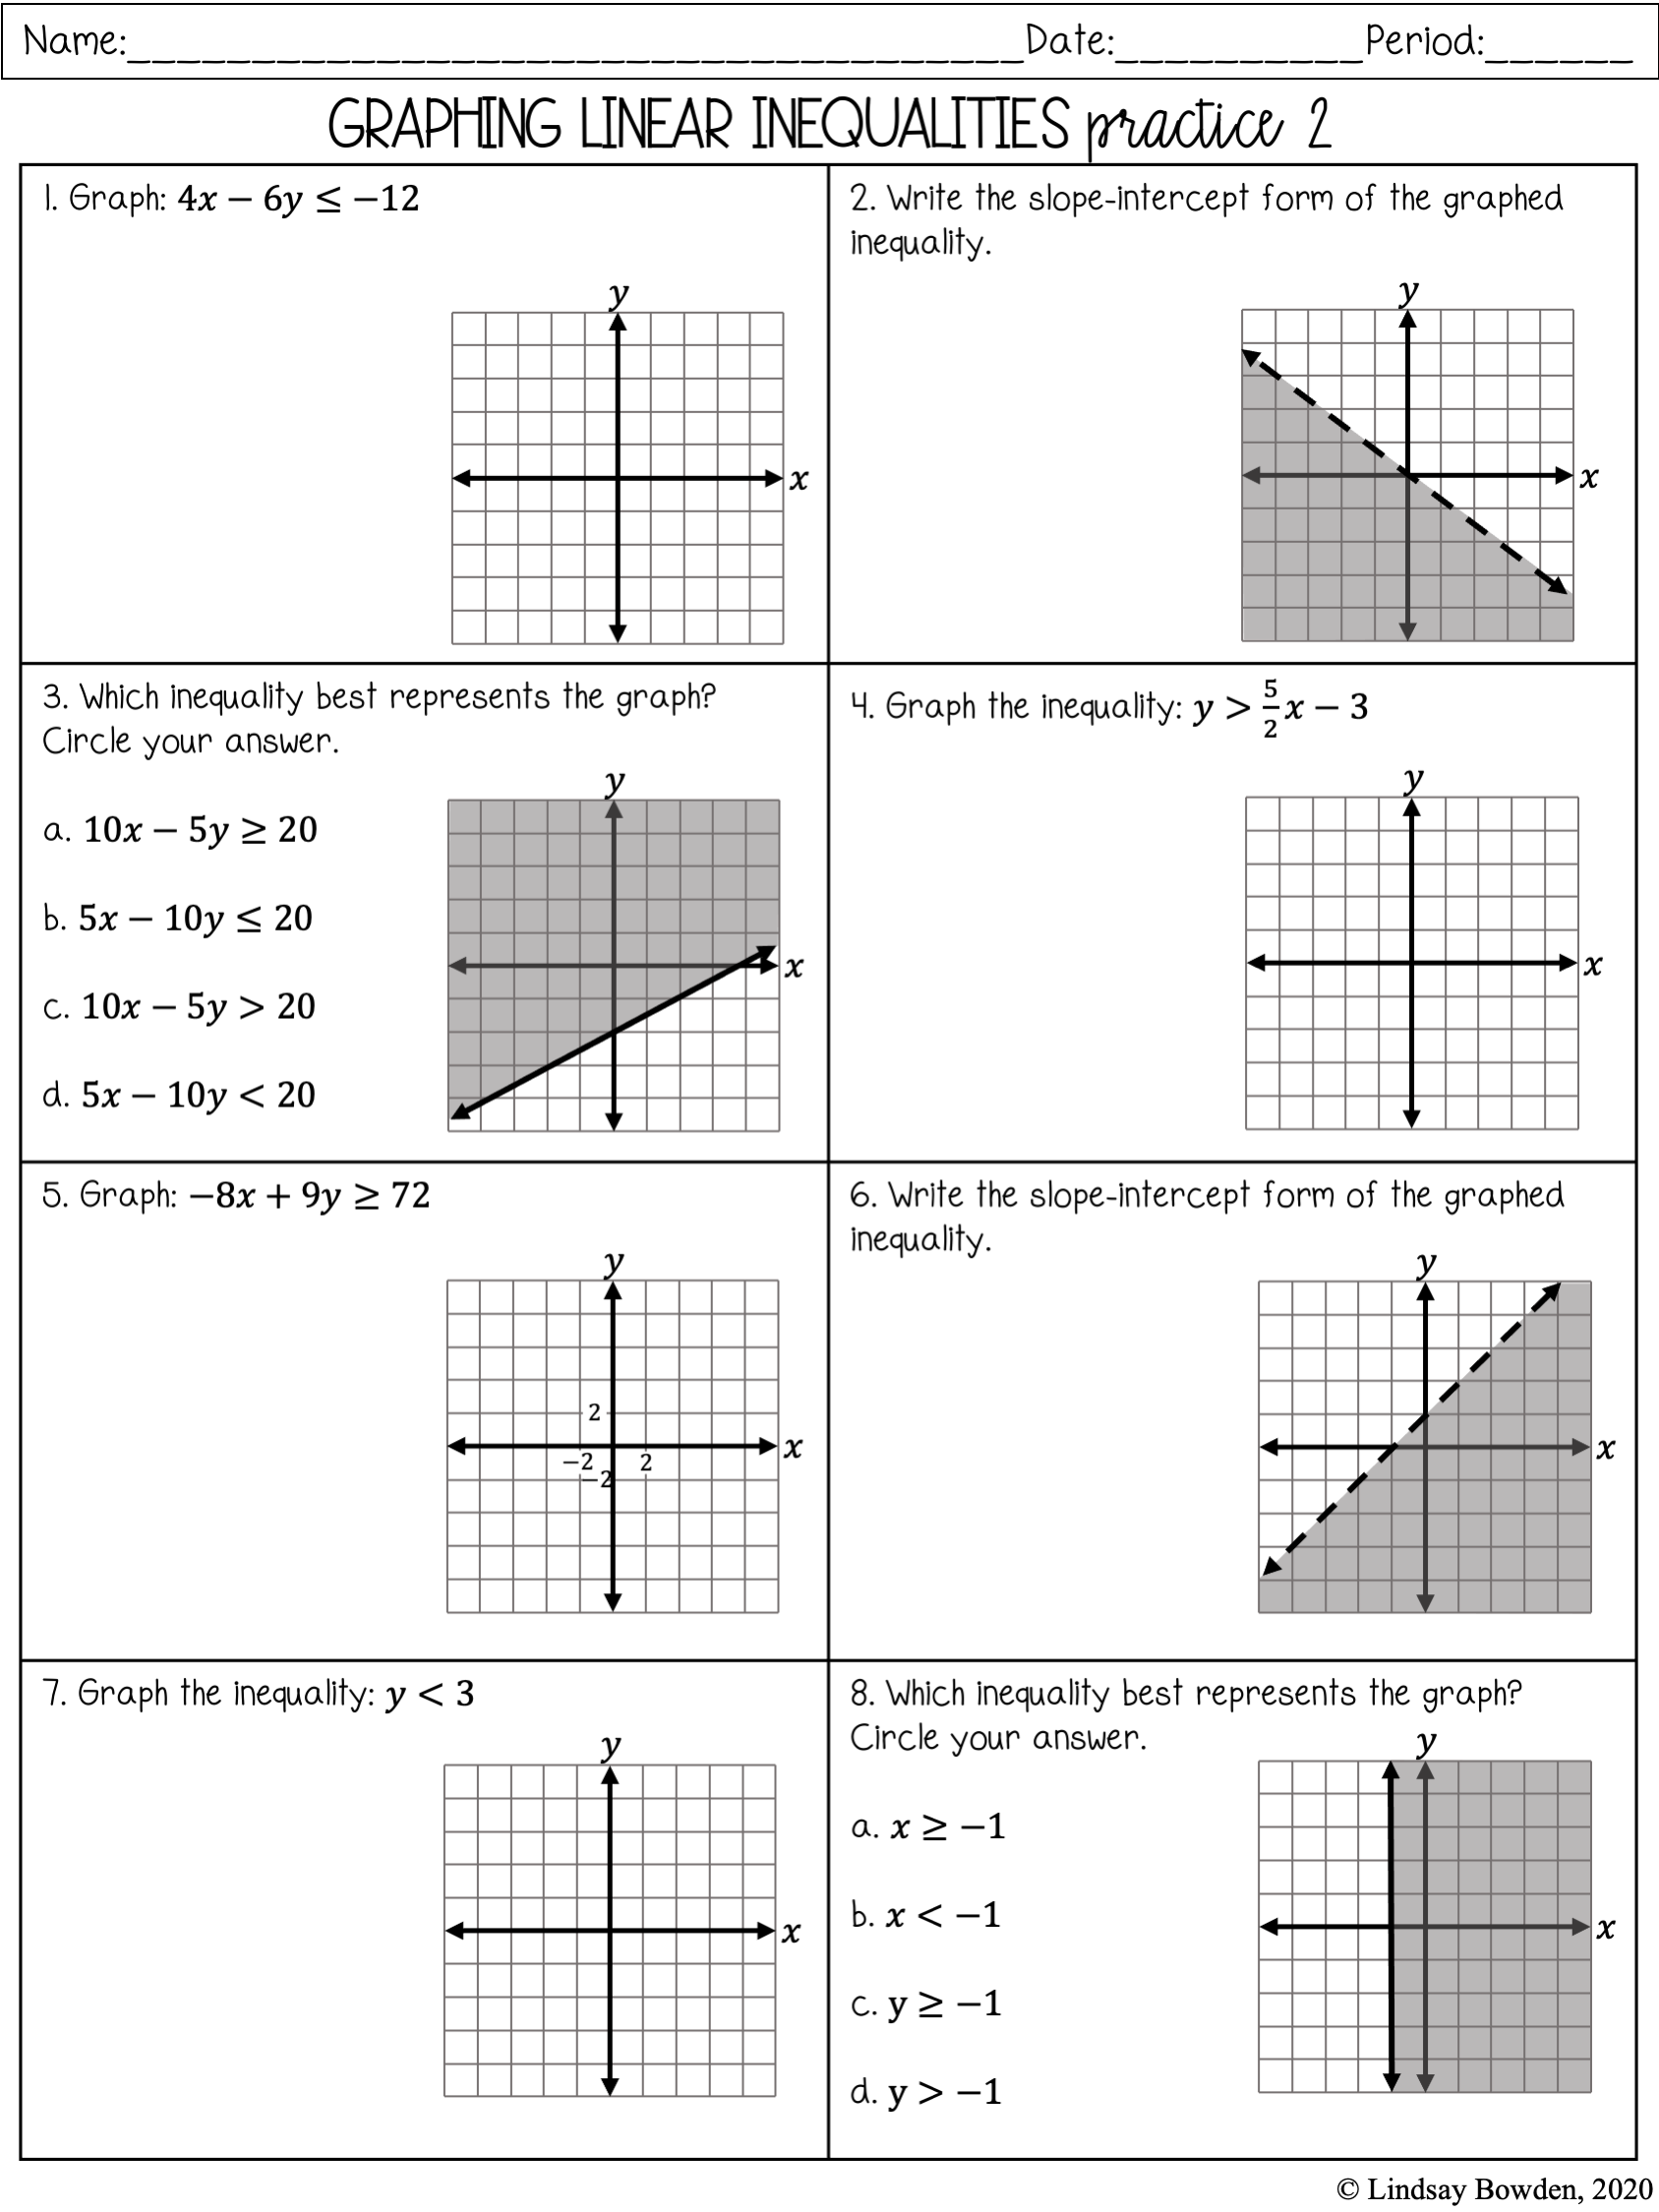
- Linear graphs: Straight lines that can be represented by the equation y = mx + b.
- Quadratic graphs: Parabolas that can be represented by the equation y = ax^2 + bx + c.
- Exponential graphs: Curves that can be represented by the equation y = a^x.
Identifying Graph Types:
- Look for patterns: Look for patterns in the coordinates, such as a consistent increase or decrease.
- Check the equation: Check the equation of the graph to identify its type.
4. Graphing Linear Equations
Graphing linear equations is a crucial skill in mathematics. To graph a linear equation, start by identifying the slope (m) and the y-intercept (b).
Slope-Intercept Form:
- y = mx + b: The slope-intercept form of a linear equation, where m is the slope and b is the y-intercept.
Graphing Linear Equations:
- Plot the y-intercept: Plot the y-intercept (b) on the y-axis.
- Use the slope: Use the slope (m) to determine the direction and steepness of the line.
- Plot additional points: Plot additional points using the slope and y-intercept.
5. Practicing with Real-World Applications
Graphing coordinate plane worksheets can be more engaging when practiced with real-world applications. Try using real-world examples, such as:
- Physics: Graphing the trajectory of a projectile.
- Economics: Graphing supply and demand curves.
- Computer Science: Graphing algorithms for computer graphics.
Benefits of Real-World Applications:
- Increased engagement: Real-world applications can increase engagement and motivation.
- Improved understanding: Real-world applications can help improve understanding of graphing concepts.
- Preparation for STEM careers: Real-world applications can prepare students for STEM careers.
📝 Note: Practice is key to mastering graphing coordinate plane worksheets. Start with simple graphs and gradually move on to more complex ones.
Now that you’ve learned these five ways to master graphing coordinate plane worksheets, it’s time to put them into practice. Remember to start with the basics, plot points accurately, identify graph types, graph linear equations, and practice with real-world applications.
The key to mastering graphing is to be patient, persistent, and practice consistently. With these strategies and techniques, you’ll be well on your way to becoming a pro at graphing coordinate plane worksheets.
What is the coordinate plane?
+The coordinate plane is a two-dimensional grid with x and y axes that intersect at the origin (0,0). Each point on the plane is represented by an ordered pair of coordinates (x,y).
How do I plot a point on the coordinate plane?
+To plot a point, start by identifying the x-coordinate (the number on the x-axis) and the y-coordinate (the number on the y-axis). Then, move horizontally to the x-coordinate and vertically to the y-coordinate.
What are the different types of graphs?
+There are several types of graphs, including linear graphs, quadratic graphs, and exponential graphs. Each type of graph has its own unique characteristics and equation forms.
Related Terms:
- Coordinate Plane worksheets PDF free
- Free printable coordinate graphing worksheets


