5 Ways to Read Ecology Graphs

Understanding Ecology Graphs: A Comprehensive Guide
Ecology graphs are a crucial tool for ecologists to visualize and communicate complex data. These graphs help us understand the relationships between different species, their environments, and the impact of human activities on ecosystems. However, deciphering ecology graphs can be a daunting task, especially for those new to the field. In this article, we will explore five ways to read ecology graphs, making it easier for you to understand and analyze these essential visual aids.
1. Identify the Type of Graph
Before diving into the data, it’s essential to identify the type of graph you’re looking at. Ecology graphs can be broadly categorized into several types, including:
- Scatter plots: Used to show the relationship between two variables, such as the relationship between temperature and species abundance.
- Bar charts: Used to compare the magnitude of different variables, such as the number of species found in different habitats.
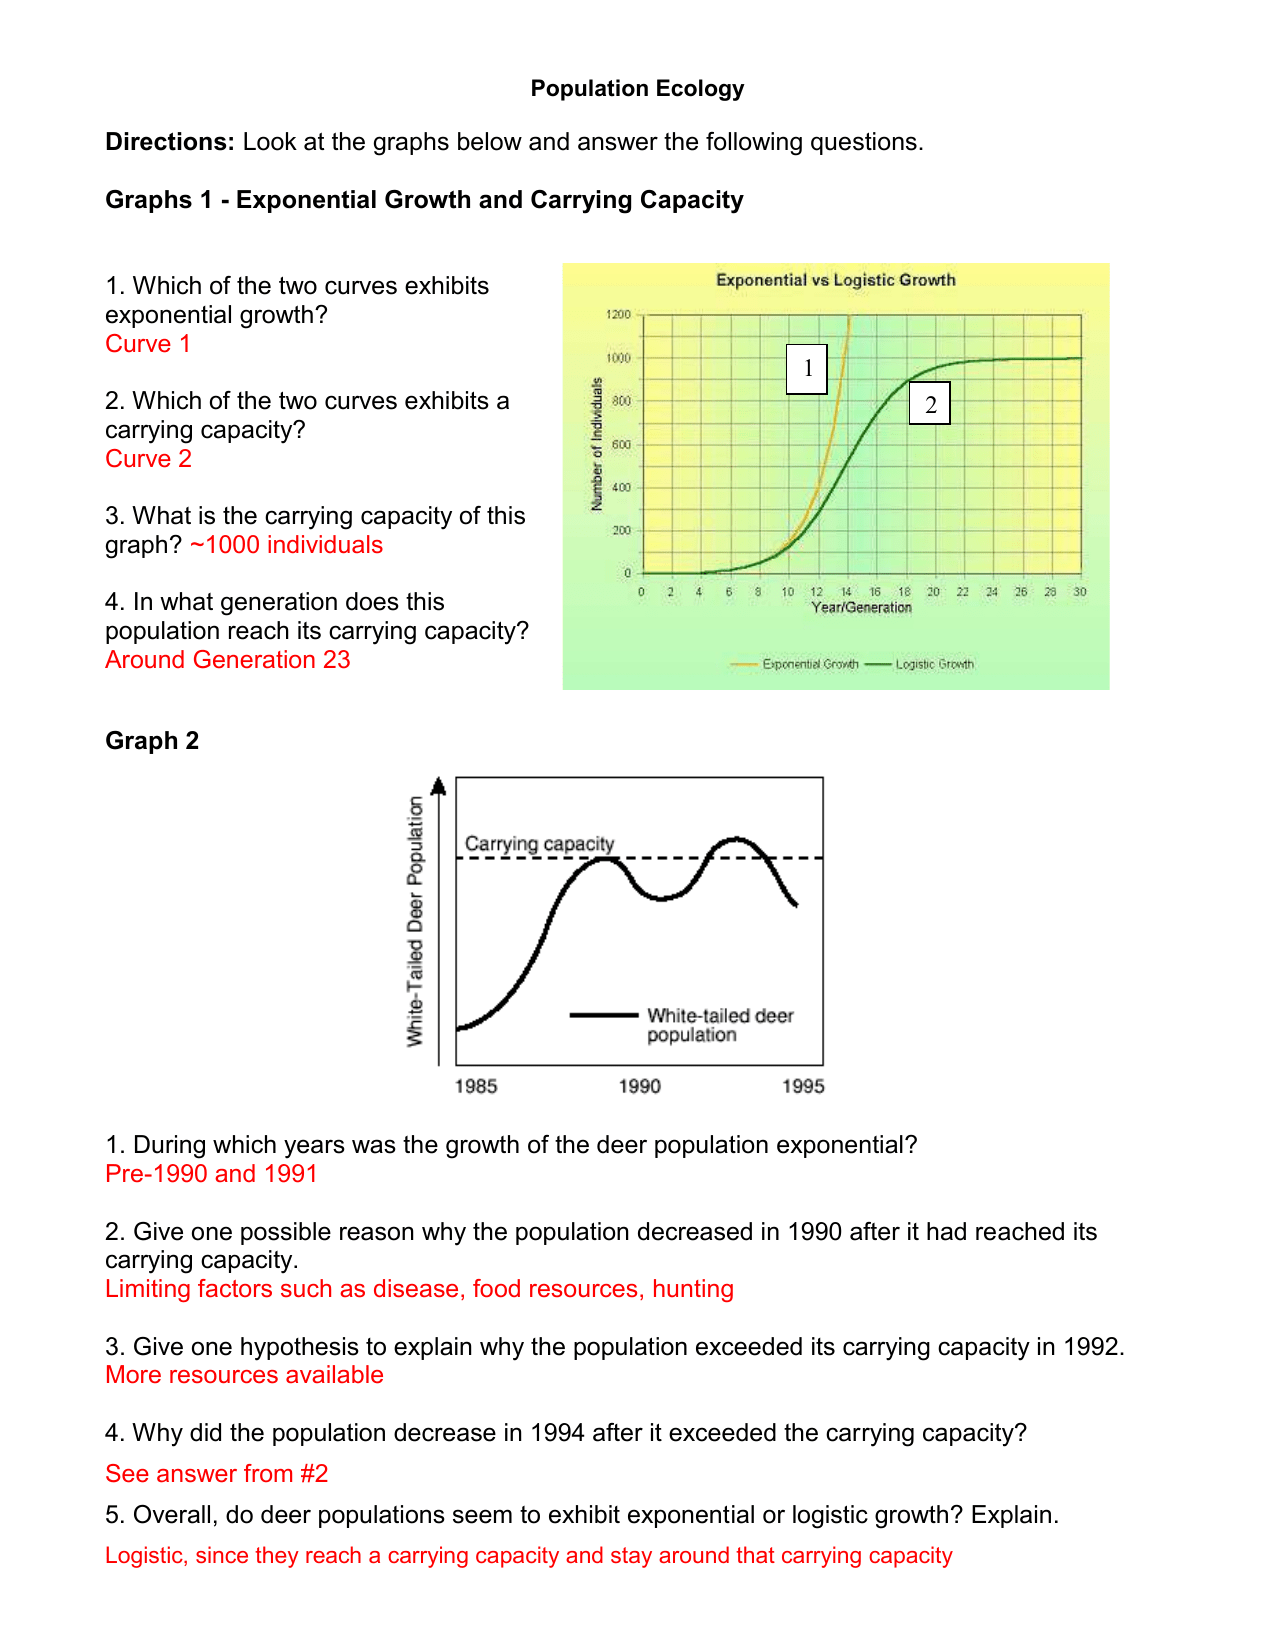
- Line graphs: Used to show trends over time or space, such as changes in population size or species composition.
- Histograms: Used to display the distribution of a single variable, such as the size distribution of trees in a forest.
Each type of graph has its unique characteristics, and understanding the type of graph you’re looking at will help you interpret the data more effectively.
2. Look for Patterns and Trends
Once you’ve identified the type of graph, look for patterns and trends in the data. Ask yourself:
- Are there any obvious relationships between variables?
- Are there any outliers or anomalies in the data?
- Are there any trends or correlations between variables?
By identifying patterns and trends, you can begin to understand the underlying mechanisms driving the ecological processes depicted in the graph.
3. Check the Axes and Labels
The axes and labels on an ecology graph are crucial for understanding the data. Make sure to check:
- Axis labels: What are the variables being measured on each axis? Are they clearly labeled?
- Units: What are the units of measurement for each variable? Are they consistent throughout the graph?
- Scale: Is the scale of the graph appropriate for the data being presented? Are there any distortions or biases in the scaling?
By checking the axes and labels, you can ensure that you’re interpreting the data correctly and avoid misinterpretation.
4. Consider the Context
Ecology graphs are often presented in a specific context, such as a research paper or a presentation. Consider the following:
- Research question: What is the research question being addressed by the graph? How does the graph relate to the broader research goals?
- Study design: What is the study design behind the graph? Are there any biases or limitations in the data collection or analysis?
- Environmental context: What is the environmental context of the study? Are there any specific environmental factors that may be influencing the data?
By considering the context, you can better understand the implications of the graph and how it contributes to our broader understanding of ecological processes.
5. Evaluate the Data Quality
Finally, evaluate the quality of the data presented in the graph. Ask yourself:
- Data sources: Where did the data come from? Are the sources reliable and credible?
- Sample size: Is the sample size sufficient to support the conclusions drawn from the graph?
- Error bars: Are error bars or confidence intervals included in the graph? If so, what do they indicate about the uncertainty in the data?
By evaluating the data quality, you can assess the reliability and validity of the graph and make more informed conclusions.
📝 Note: When evaluating ecology graphs, it's essential to consider the data quality, context, and study design to ensure accurate interpretation and avoid misinterpretation.
Conclusion
Reading ecology graphs requires a combination of technical skills, attention to detail, and contextual understanding. By identifying the type of graph, looking for patterns and trends, checking the axes and labels, considering the context, and evaluating the data quality, you can effectively interpret and analyze ecology graphs. Whether you’re a seasoned ecologist or just starting your journey in the field, mastering the skills to read ecology graphs will help you better understand the complex relationships between species, their environments, and the impact of human activities on ecosystems.
What is the most common type of ecology graph?
+
Scatter plots are one of the most common types of ecology graphs, used to show the relationship between two variables.
How do I identify the type of graph?
+
Look for the arrangement of data points, lines, or bars to determine the type of graph. You can also check the axis labels and title to confirm the type of graph.
What is the importance of context in interpreting ecology graphs?
+
Context is crucial in interpreting ecology graphs, as it provides information about the research question, study design, and environmental factors that may influence the data.


