5 Ways to Master Domain and Range Graphs

Mastering domain and range graphs is a fundamental skill for any student of mathematics, particularly those pursuing advanced studies in calculus, algebra, and geometry. These graphs represent the relationship between the input (domain) and output (range) of a function, providing valuable insights into the behavior of mathematical functions. In this article, we will explore five ways to master domain and range graphs, helping you to better understand and work with these essential mathematical concepts.
Understanding Domain and Range Basics
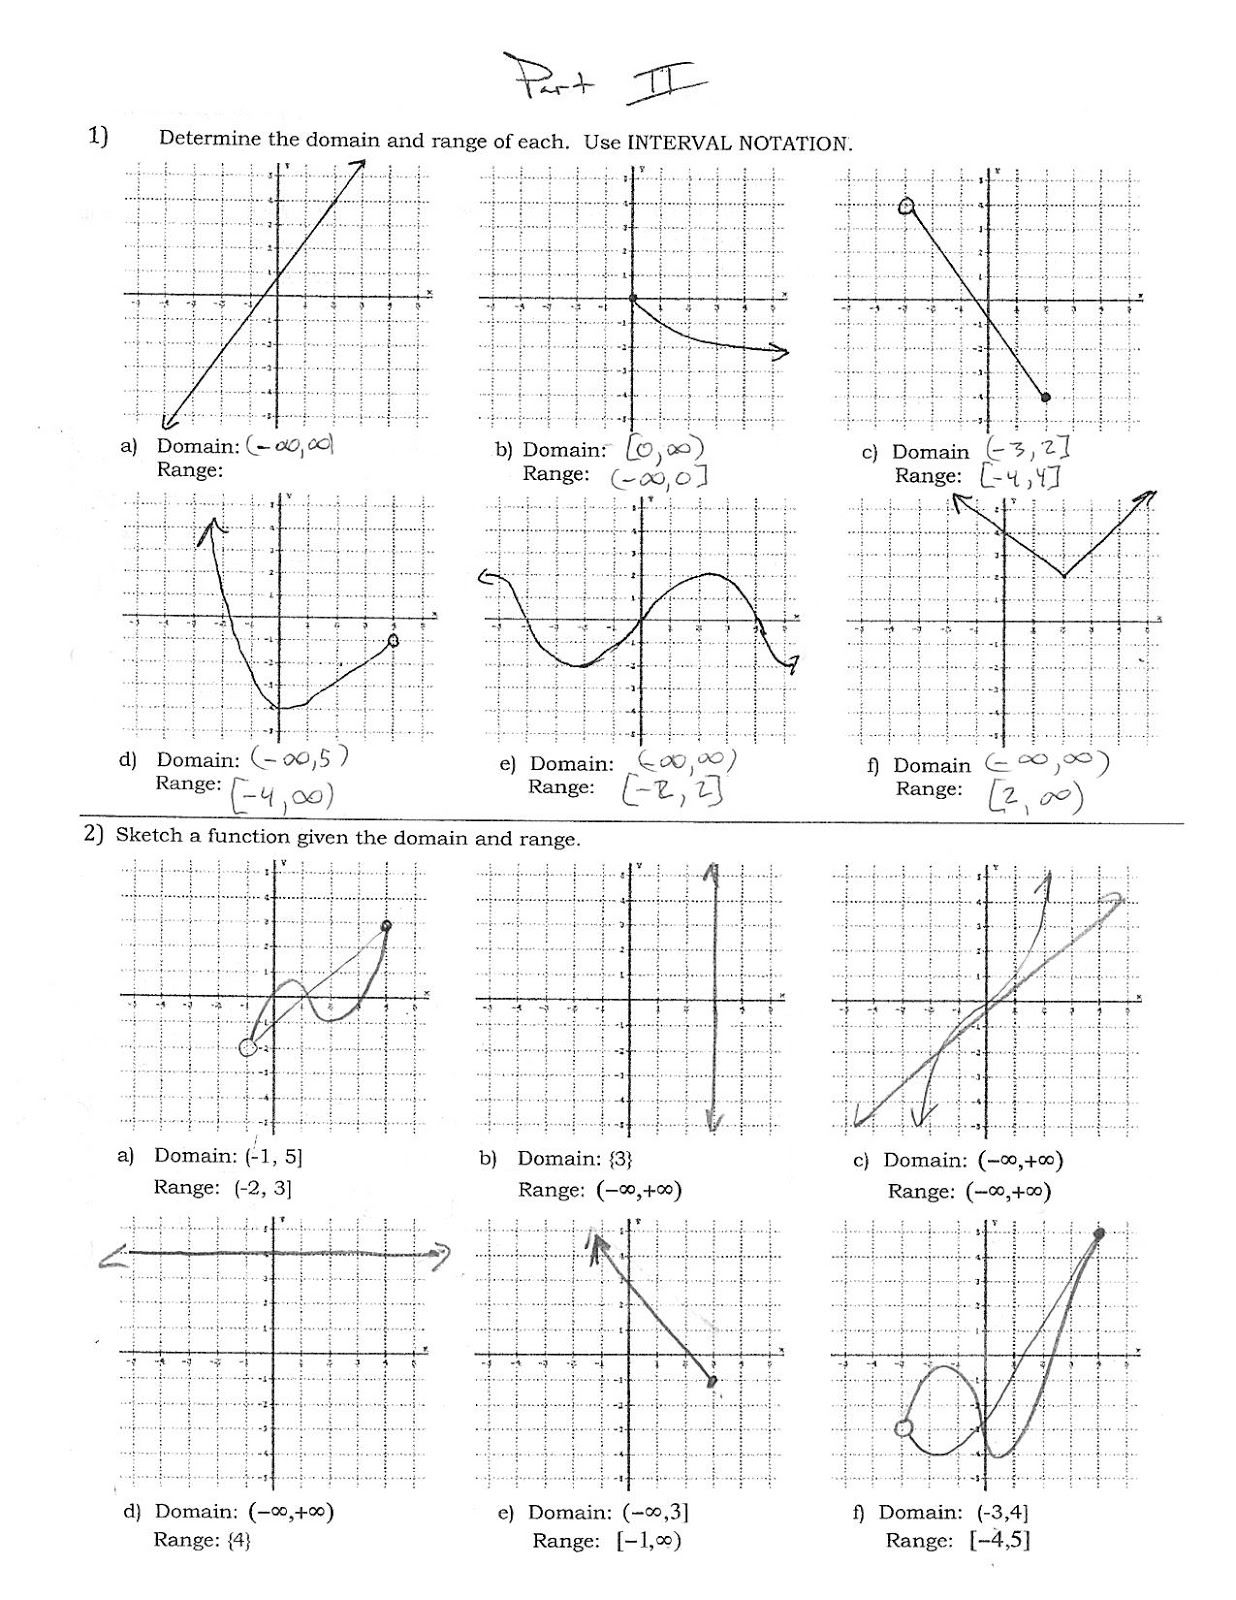
Before diving into the five ways to master domain and range graphs, it’s essential to understand the basics of these concepts. The domain of a function is the set of all possible input values (x-values) for which the function is defined, while the range is the set of all possible output values (y-values) that the function can produce.
For example, consider the simple linear function f(x) = 2x. The domain of this function is all real numbers (x can be any value), and the range is also all real numbers (y can be any value). However, if we consider the function f(x) = 1/x, the domain is all real numbers except x = 0 (since division by zero is undefined), and the range is all real numbers except y = 0.
1. Graphing Functions Using a Table of Values
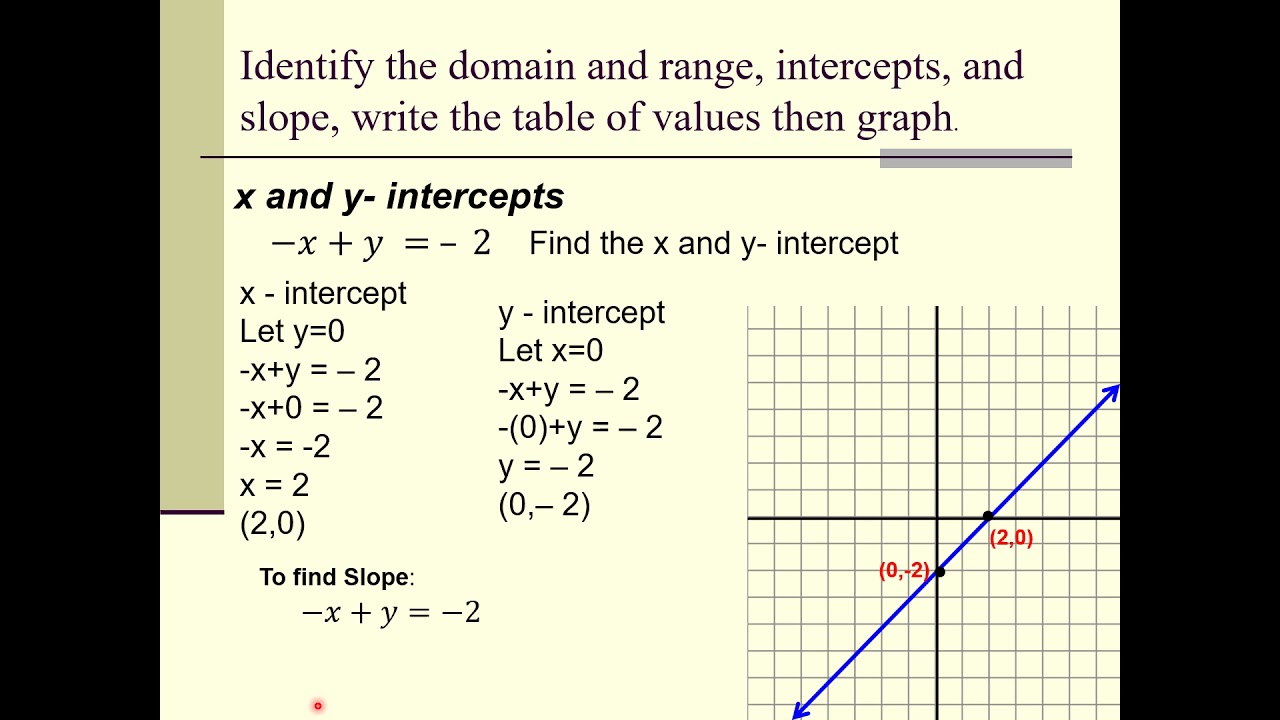
One effective way to master domain and range graphs is by creating a table of values for a given function. This involves calculating the output (y-value) for a range of input values (x-values) and plotting the resulting points on a coordinate plane.
Consider the function f(x) = x^2. To graph this function using a table of values, we can calculate the output for a range of input values, such as x = -2, -1, 0, 1, and 2.

| x | f(x) |
|---|---|
| -2 | 4 |
| -1 | 1 |
| 0 | 0 |
| 1 | 1 |
| 2 | 4 |
By plotting these points on a coordinate plane, we can visualize the graph of the function and identify its domain and range.
💡 Note: When creating a table of values, make sure to include a range of input values that cover the entire domain of the function.
2. Using Algebraic Methods to Find Domain and Range
Another way to master domain and range graphs is by using algebraic methods to find the domain and range of a function. This involves analyzing the function’s equation to determine the values of x that make the function undefined or produce a specific output.
For example, consider the function f(x) = 1/(x-2). To find the domain of this function, we need to determine the values of x that make the denominator (x-2) equal to zero.
| x | f(x) |
|---|---|
| 2 | undefined |
As we can see, the function is undefined when x = 2, so the domain of the function is all real numbers except x = 2.
📝 Note: When using algebraic methods, make sure to consider any restrictions on the domain or range, such as division by zero or square roots of negative numbers.
3. Visualizing Domain and Range Using Graphing Calculators
Graphing calculators are a powerful tool for visualizing domain and range graphs. By entering the function’s equation into the calculator, we can quickly generate a graph and identify the domain and range.
For example, consider the function f(x) = x^3 - 2x^2 - 5x + 1. Using a graphing calculator, we can generate a graph of the function and identify its domain and range.
[Insert image of graphing calculator output]
📊 Note: When using graphing calculators, make sure to adjust the window settings to ensure that the entire graph is visible.
4. Analyzing Domain and Range Using Function Transformations
Function transformations are another way to master domain and range graphs. By applying transformations to a base function, we can create new functions with different domains and ranges.
For example, consider the base function f(x) = x^2. By applying a vertical shift transformation, we can create a new function f(x) = x^2 + 2.
| x | f(x) |
|---|---|
| -2 | 6 |
| -1 | 3 |
| 0 | 2 |
| 1 | 3 |
| 2 | 6 |
As we can see, the vertical shift transformation has changed the range of the function, but not the domain.
💡 Note: When analyzing function transformations, make sure to consider the effects of the transformation on the domain and range.
5. Practicing with Real-World Applications
Finally, mastering domain and range graphs requires practice with real-world applications. By working with functions that model real-world phenomena, we can develop a deeper understanding of the importance of domain and range.
For example, consider a function that models the cost of producing a product, where the input is the number of units produced and the output is the total cost. By analyzing the domain and range of this function, we can gain insights into the production process and make informed decisions.
📊 Note: When practicing with real-world applications, make sure to consider the context and any restrictions on the domain or range.
In conclusion, mastering domain and range graphs requires a combination of theoretical knowledge, algebraic skills, and practical experience. By following these five ways to master domain and range graphs, you’ll be well on your way to becoming proficient in this essential mathematical skill.
What is the difference between domain and range?
+
The domain of a function is the set of all possible input values (x-values) for which the function is defined, while the range is the set of all possible output values (y-values) that the function can produce.
How do I find the domain and range of a function?
+
There are several ways to find the domain and range of a function, including using algebraic methods, graphing calculators, and function transformations.
Why is it important to understand domain and range?
+
Understanding domain and range is essential for working with functions and modeling real-world phenomena. It helps you to identify the limitations and behavior of a function, making it a crucial skill in mathematics and science.


