5 Ways to Master Distance Time Graphs
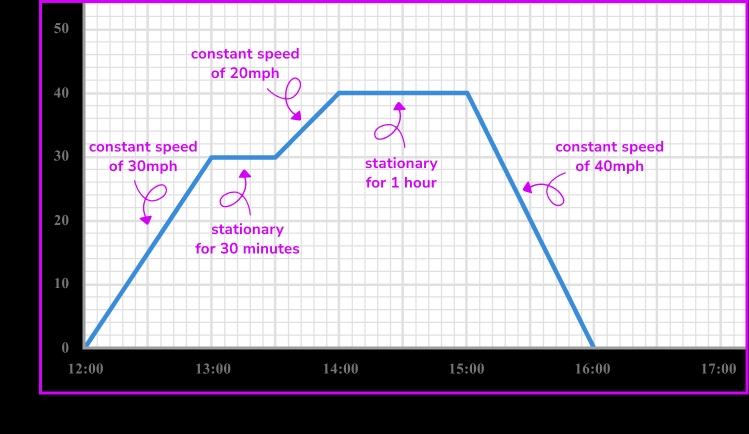
Understanding Distance Time Graphs
Distance time graphs are a fundamental concept in physics and mathematics, used to represent the relationship between the distance traveled by an object and the time taken to travel that distance. These graphs are essential in understanding the motion of objects, and mastering them is crucial for students of physics and mathematics. In this article, we will explore five ways to master distance time graphs.
1. Understand the Basics
To master distance time graphs, it is essential to understand the basics. A distance time graph is a graphical representation of the distance traveled by an object against the time taken to travel that distance. The graph is typically plotted with time on the x-axis and distance on the y-axis. The resulting graph can be a straight line, a curve, or a combination of both.
Key Terms:
- Distance: The total length of the path traveled by an object.
- Time: The duration taken by an object to travel a certain distance.
- Speed: The rate of change of distance with respect to time.
2. Learn to Interpret Graphs
Interpreting distance time graphs is a crucial skill to master. By looking at the graph, you can determine the distance traveled by an object at any given time, the speed of the object, and the acceleration of the object.
- Straight Line: A straight line on a distance time graph indicates a constant speed.
- Curve: A curve on a distance time graph indicates a changing speed.
- Gradient: The gradient of a distance time graph represents the speed of the object.
🔍 Note: The gradient of a distance time graph is calculated by dividing the distance traveled by the time taken.
3. Practice Drawing Graphs
Practicing drawing distance time graphs is an excellent way to master them. Start by plotting simple graphs with constant speeds, and then move on to more complex graphs with changing speeds.
Tips:
- Use a Ruler: Use a ruler to draw straight lines and curves.
- Label Axes: Label the x-axis and y-axis clearly.
- Use Different Colors: Use different colors to represent different speeds or distances.
4. Analyze Real-World Examples
Analyzing real-world examples of distance time graphs can help you understand the concept better. Look at examples of objects moving at constant speeds, such as a car traveling at a constant speed on a straight road, or objects moving at changing speeds, such as a car accelerating from rest.
Examples:
- Car Traveling at Constant Speed: A car traveling at a constant speed of 60 km/h for 2 hours will cover a distance of 120 km.
- Car Accelerating from Rest: A car accelerating from rest to a speed of 60 km/h in 10 seconds will cover a distance of 20 meters.
5. Use Online Resources
There are many online resources available to help you master distance time graphs. Websites such as Khan Academy, BBC Bitesize, and Math Open Reference offer interactive graphs, quizzes, and exercises to help you practice and improve your skills.
Websites:
- Khan Academy: Khan Academy offers interactive distance time graphs and exercises to help you practice.
- BBC Bitesize: BBC Bitesize offers video tutorials and quizzes on distance time graphs.
- Math Open Reference: Math Open Reference offers an interactive distance time graph calculator.
In conclusion, mastering distance time graphs requires practice, patience, and persistence. By following these five ways to master distance time graphs, you can improve your understanding of the concept and become proficient in analyzing and interpreting graphs.
What is a distance time graph?
+A distance time graph is a graphical representation of the distance traveled by an object against the time taken to travel that distance.
How do I calculate the speed of an object from a distance time graph?
+The speed of an object can be calculated by dividing the distance traveled by the time taken.
What does a straight line on a distance time graph indicate?
+A straight line on a distance time graph indicates a constant speed.
