Two Way Tables Independent Practice Made Easy

Unlocking the Power of Two Way Tables: Independent Practice Made Easy
Are you tired of struggling to understand two-way tables? Do you find it challenging to interpret the data and make informed decisions? You’re not alone. Two-way tables can be intimidating, but with the right approach, you can master them and take your data analysis skills to the next level.
In this article, we’ll break down the concept of two-way tables, explore its applications, and provide you with a step-by-step guide on how to create and analyze them. By the end of this article, you’ll be able to tackle two-way tables with confidence and make data-driven decisions with ease.
What are Two-Way Tables?
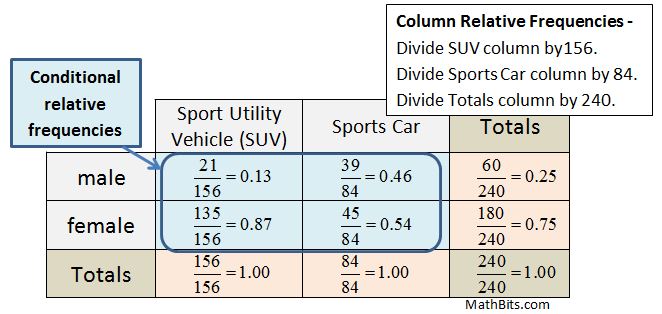
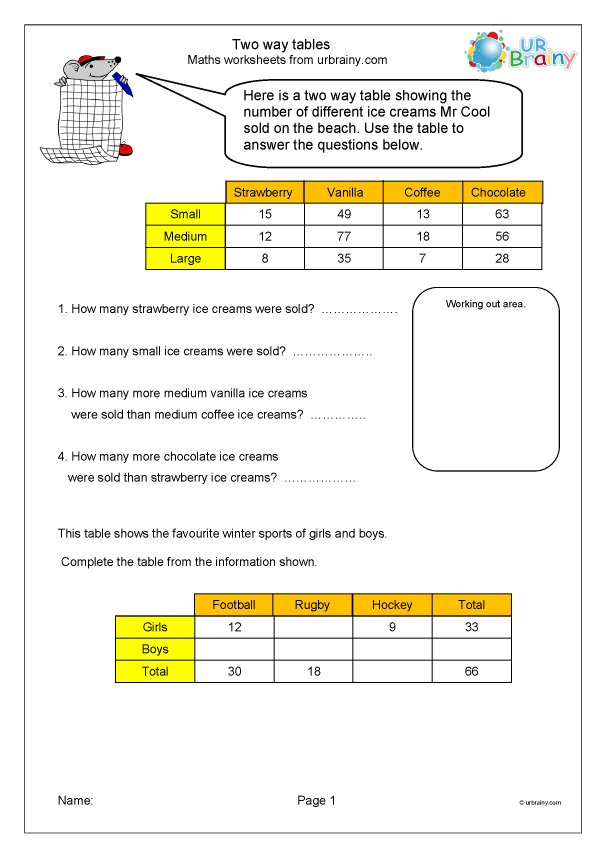
A two-way table, also known as a contingency table or cross-tabulation table, is a statistical tool used to analyze the relationship between two categorical variables. It’s a powerful tool that helps you understand how different variables interact with each other and identify patterns, trends, and correlations.
Imagine you’re a marketing manager, and you want to know how different age groups respond to a new product. You collect data on the age group and the response to the product (e.g., positive, negative, or neutral). A two-way table would help you visualize the relationship between these two variables and identify patterns, such as:
- Which age group is more likely to respond positively to the product?
- Is there a significant difference in response between different age groups?
- Are there any trends or correlations between age and response?
How to Create a Two-Way Table
Creating a two-way table is a straightforward process that involves the following steps:
- Define the variables: Identify the two categorical variables you want to analyze. In our example, the variables are age group and response to the product.
- Collect data: Gather data on the two variables. You can use surveys, experiments, or observational studies to collect data.
- Create a table: Set up a table with the two variables as headers. The rows will represent one variable (e.g., age group), and the columns will represent the other variable (e.g., response to the product).
- Fill in the table: Enter the data into the table, making sure to include the frequency or count of each combination of variables.
Here’s an example of a two-way table:

| Age Group | Positive Response | Negative Response | Neutral Response |
|---|---|---|---|
| 18-24 | 10 | 5 | 3 |
| 25-34 | 15 | 8 | 2 |
| 35-44 | 12 | 10 | 5 |
| 45-54 | 8 | 12 | 8 |
| 55+ | 5 | 15 | 10 |
How to Analyze a Two-Way Table
Analyzing a two-way table involves interpreting the data to identify patterns, trends, and correlations. Here are some steps to help you analyze a two-way table:
- Look for patterns: Examine the table for patterns, such as rows or columns with high or low frequencies.
- Calculate percentages: Calculate the percentage of each combination of variables to help identify trends.
- Identify correlations: Look for correlations between the two variables, such as a strong positive or negative relationship.
- Draw conclusions: Based on your analysis, draw conclusions about the relationship between the two variables.
In our example, we can analyze the table to identify patterns, such as:
- The 25-34 age group has the highest positive response rate (15).
- The 55+ age group has the highest negative response rate (15).
- There is a positive correlation between age and positive response rate.
📊 Note: Two-way tables can be used to analyze more than two variables, but it's essential to keep the number of variables manageable to avoid complexity.
Common Applications of Two-Way Tables
Two-way tables have numerous applications in various fields, including:
- Marketing research: Two-way tables can help marketers understand how different demographics respond to products or services.
- Medical research: Two-way tables can help researchers understand the relationship between different variables, such as age and disease incidence.
- Social sciences: Two-way tables can help researchers understand the relationship between different variables, such as income and education level.
Conclusion
Two-way tables are a powerful tool for analyzing the relationship between two categorical variables. By following the steps outlined in this article, you can create and analyze two-way tables with ease. Remember to look for patterns, calculate percentages, identify correlations, and draw conclusions based on your analysis. With practice, you’ll become proficient in using two-way tables to make data-driven decisions.
What is the purpose of a two-way table?
+A two-way table is used to analyze the relationship between two categorical variables.
How do I create a two-way table?
+To create a two-way table, define the variables, collect data, create a table, and fill in the data.
What are some common applications of two-way tables?
+Two-way tables are commonly used in marketing research, medical research, and social sciences.
Related Terms:
- Two way table worksheet with answers
- Two-way frequency table worksheet
- Probability two-way tables
- Frequency table worksheets


