5 Ways to Master Stem and Leaf Plots
Understanding the Basics of Stem and Leaf Plots
Stem and leaf plots, also known as stem plots, are a type of graphical representation used to display the distribution of data. They are particularly useful for smaller datasets and can be used to visualize the shape of the data, identify patterns, and understand the distribution of values. In this blog post, we will explore five ways to master stem and leaf plots, including understanding the basics, creating a stem and leaf plot, interpreting the plot, using stem and leaf plots for comparison, and using technology to create stem and leaf plots.
Understanding the Basics of Stem and Leaf Plots
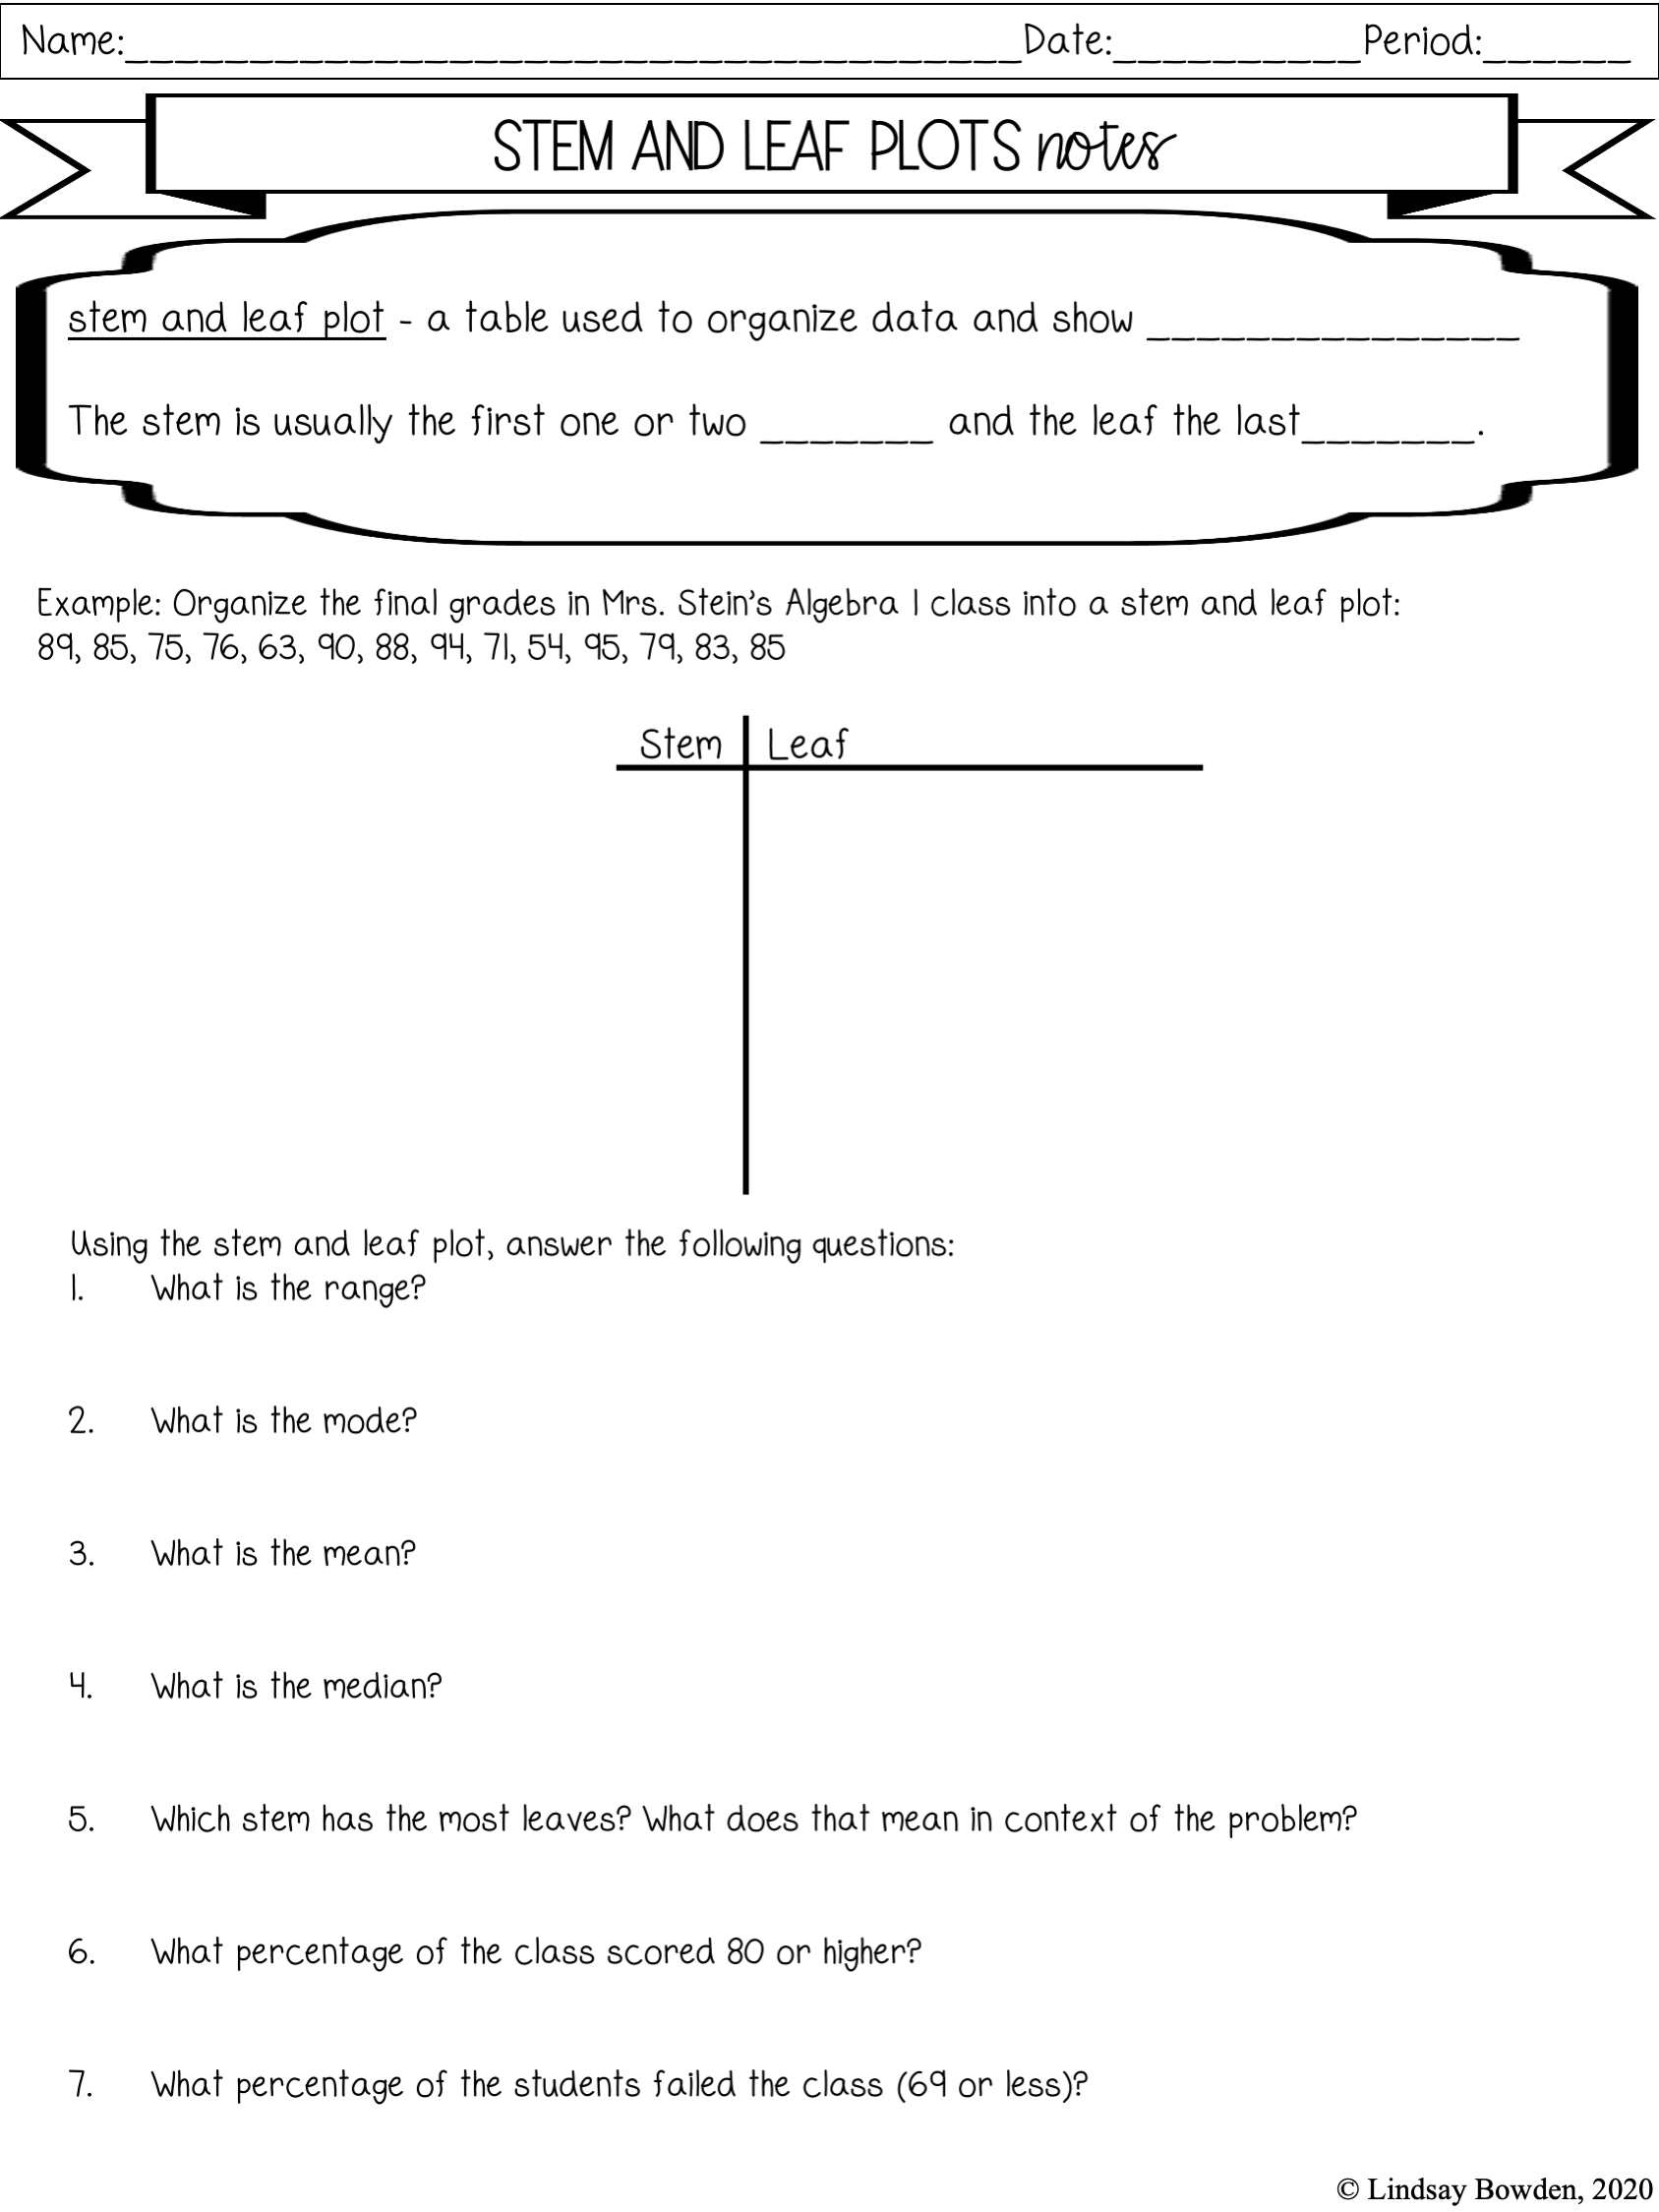
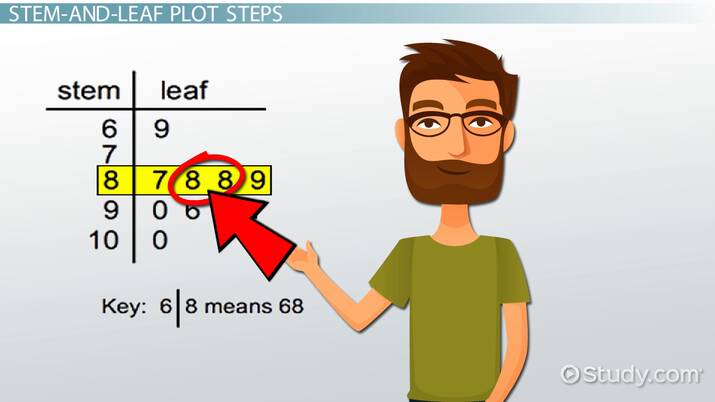
A stem and leaf plot consists of two columns: the stem and the leaf. The stem represents the first part of the data value, while the leaf represents the latter part. For example, if we have a dataset of exam scores with values ranging from 50 to 100, the stem might represent the tens digit (50, 60, 70, etc.), while the leaf represents the ones digit (0, 1, 2, etc.). The stem and leaf plot is a compact way to display the data, making it easier to visualize the distribution of values.
Creating a Stem and Leaf Plot
Creating a stem and leaf plot is a straightforward process. Here are the steps:
- Step 1: Determine the stem and leaf for each data value. For example, if we have a dataset of exam scores with values ranging from 50 to 100, we might use the tens digit as the stem and the ones digit as the leaf.
- Step 2: List the stems in a column, in order from smallest to largest.
- Step 3: List the leaves for each stem, in order from smallest to largest.
- Step 4: Combine the stems and leaves to create the stem and leaf plot.
📝 Note: When creating a stem and leaf plot, it's essential to ensure that the stems are in order from smallest to largest, and the leaves are also in order from smallest to largest.
For example, let’s say we have the following dataset of exam scores:
| Score |
|---|
| 56 |
| 73 |
| 82 |
| 91 |
| 67 |
| 85 |
| 99 |
To create a stem and leaf plot, we would first determine the stem and leaf for each data value:
| Score | Stem | Leaf |
|---|---|---|
| 56 | 5 | 6 |
| 73 | 7 | 3 |
| 82 | 8 | 2 |
| 91 | 9 | 1 |
| 67 | 6 | 7 |
| 85 | 8 | 5 |
| 99 | 9 | 9 |
Next, we would list the stems in a column, in order from smallest to largest:
| Stem |
|---|
| 5 |
| 6 |
| 7 |
| 8 |
| 9 |
Then, we would list the leaves for each stem, in order from smallest to largest:
| Stem | Leaf |
|---|---|
| 5 | 6 |
| 6 | 7 |
| 7 | 3 |
| 8 | 2, 5 |
| 9 | 1, 9 |
Finally, we would combine the stems and leaves to create the stem and leaf plot:
| Stem | Leaf |
|---|---|
| 5 | 6 |
| 6 | 7 |
| 7 | 3 |
| 8 | 2, 5 |
| 9 | 1, 9 |
Interpreting the Stem and Leaf Plot
Once we have created the stem and leaf plot, we can use it to understand the distribution of the data. Here are some things to look for:
- Shape: Look for the overall shape of the data. Is it symmetrical, or is it skewed to one side?
- Center: Look for the center of the data. Is it clustered around a particular value, or is it spread out?
- Spread: Look for the spread of the data. Is it concentrated in a small range, or is it spread out over a larger range?
📊 Note: When interpreting the stem and leaf plot, it's essential to consider the context of the data. What does the data represent, and what insights can we gain from the plot?
For example, let’s say we are analyzing the exam scores dataset from earlier. From the stem and leaf plot, we can see that the data is slightly skewed to the right, with a cluster of values around 80-90. We can also see that the data is spread out over a range of 40 points, from 56 to 99.
Using Stem and Leaf Plots for Comparison
Stem and leaf plots can also be used to compare two or more datasets. Here’s how:
- Step 1: Create a stem and leaf plot for each dataset.
- Step 2: Compare the plots to identify similarities and differences.
For example, let’s say we have two datasets of exam scores: one for students who received extra tutoring, and one for students who did not receive extra tutoring. We can create a stem and leaf plot for each dataset and compare the plots to see if there are any differences in the distribution of scores.
Using Technology to Create Stem and Leaf Plots
While it’s possible to create stem and leaf plots by hand, technology can make the process much easier. Here are some options:
- Spreadsheets: Many spreadsheet software programs, such as Microsoft Excel or Google Sheets, have built-in functions for creating stem and leaf plots.
- Statistical software: Statistical software programs, such as R or SAS, often have built-in functions for creating stem and leaf plots.
- Online tools: There are many online tools available for creating stem and leaf plots, such as Stem and Leaf Plot Generator or Create a Stem and Leaf Plot.
📊 Note: When using technology to create a stem and leaf plot, make sure to check the output to ensure that it is accurate and complete.
In summary, stem and leaf plots are a powerful tool for understanding the distribution of data. By mastering the basics, creating a stem and leaf plot, interpreting the plot, using stem and leaf plots for comparison, and using technology to create stem and leaf plots, you can gain a deeper understanding of your data and make more informed decisions.
What is a stem and leaf plot?
+A stem and leaf plot is a type of graphical representation used to display the distribution of data. It consists of two columns: the stem and the leaf. The stem represents the first part of the data value, while the leaf represents the latter part.
How do I create a stem and leaf plot?
+To create a stem and leaf plot, determine the stem and leaf for each data value, list the stems in a column in order from smallest to largest, list the leaves for each stem in order from smallest to largest, and combine the stems and leaves to create the plot.
What can I learn from a stem and leaf plot?
+A stem and leaf plot can be used to understand the distribution of the data, including the shape, center, and spread. It can also be used to compare two or more datasets.
Related Terms:
- stem and leaf plot worksheet high school
- Stem-and-leaf plot quiz pdf
