5 Easy Ways to Create Stem and Leaf Plots

Understanding Stem and Leaf Plots
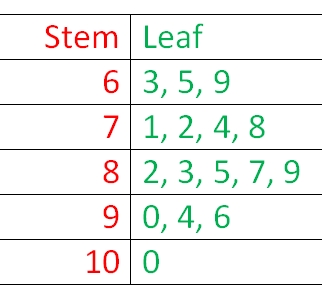
Stem and leaf plots are a type of graph used to display the distribution of a set of data. They are particularly useful for visualizing the shape of a distribution and for identifying patterns or outliers in the data. In this article, we will explore 5 easy ways to create stem and leaf plots, along with some examples and tips to help you get started.
Method 1: Creating a Stem and Leaf Plot by Hand
Creating a stem and leaf plot by hand is a simple and straightforward process. Here’s how to do it:
- Step 1: Start by writing down the data set you want to create a stem and leaf plot for.
- Step 2: Separate the data into two parts: the “stem” and the “leaf”. The stem is the first digit of each number, and the leaf is the remaining digits.
- Step 3: Write down the stems in a column, with the smallest stem at the top and the largest stem at the bottom.
- Step 4: Next to each stem, write down the corresponding leaves.
- Step 5: Arrange the leaves in order from smallest to largest.
For example, suppose we have the following data set: 12, 15, 18, 22, 25, 30, 35, 40, 45, 50.

| Stem | Leaf |
|---|---|
| 1 | 2, 5, 8 |
| 2 | 2, 5 |
| 3 | 0, 5 |
| 4 | 0, 5 |
| 5 | 0 |
Method 2: Using a Calculator to Create a Stem and Leaf Plot
Many calculators have a built-in function for creating stem and leaf plots. Here’s how to do it:
- Step 1: Enter the data set into your calculator.
- Step 2: Use the calculator’s built-in function to create a stem and leaf plot.
- Step 3: Adjust the settings as needed to customize the plot.
For example, on a TI-83 calculator, you can create a stem and leaf plot by going to “STAT PLOTS” and selecting “Stem and Leaf Plot”.
Method 3: Using a Spreadsheet to Create a Stem and Leaf Plot
Spreadsheets like Excel or Google Sheets can also be used to create stem and leaf plots. Here’s how to do it:
- Step 1: Enter the data set into a spreadsheet.
- Step 2: Use the spreadsheet’s built-in functions to separate the data into stems and leaves.
- Step 3: Use the spreadsheet’s charting tools to create a stem and leaf plot.
For example, in Excel, you can use the “TEXT” function to separate the data into stems and leaves, and then use the “PIVOTTABLE” function to create a stem and leaf plot.
Method 4: Using Online Tools to Create a Stem and Leaf Plot
There are many online tools available that can help you create a stem and leaf plot. Here’s how to do it:
- Step 1: Go to an online tool like Stat Trek or Math Open Reference.
- Step 2: Enter the data set into the tool.
- Step 3: Use the tool’s built-in functions to create a stem and leaf plot.
For example, on Stat Trek, you can enter the data set and select “Stem and Leaf Plot” from the drop-down menu.
Method 5: Using R or Python to Create a Stem and Leaf Plot
If you’re comfortable with programming languages like R or Python, you can use them to create a stem and leaf plot. Here’s how to do it:
- Step 1: Enter the data set into R or Python.
- Step 2: Use the language’s built-in functions to separate the data into stems and leaves.
- Step 3: Use the language’s charting tools to create a stem and leaf plot.
For example, in R, you can use the “stem” function to create a stem and leaf plot.
🤔 Note: Regardless of the method you choose, make sure to check the plot for any errors or inconsistencies.
Conclusion
In this article, we’ve explored 5 easy ways to create stem and leaf plots. Whether you prefer to do it by hand, use a calculator or spreadsheet, or take advantage of online tools or programming languages, there’s a method that’s right for you. By following these steps, you can create a stem and leaf plot that helps you visualize and understand your data.
What is a stem and leaf plot?
+A stem and leaf plot is a type of graph used to display the distribution of a set of data.
How do I create a stem and leaf plot?
+There are several ways to create a stem and leaf plot, including by hand, using a calculator or spreadsheet, or taking advantage of online tools or programming languages.
What are the benefits of using a stem and leaf plot?
+A stem and leaf plot can help you visualize and understand your data, identify patterns or outliers, and communicate complex data insights to others.
Related Terms:
- stem and leaf plot worksheet high school
- Stem-and-leaf plot quiz pdf


