Solubility Graph Worksheet for Easy Chemistry Solutions

Solubility Graph Worksheet for Easy Chemistry Solutions
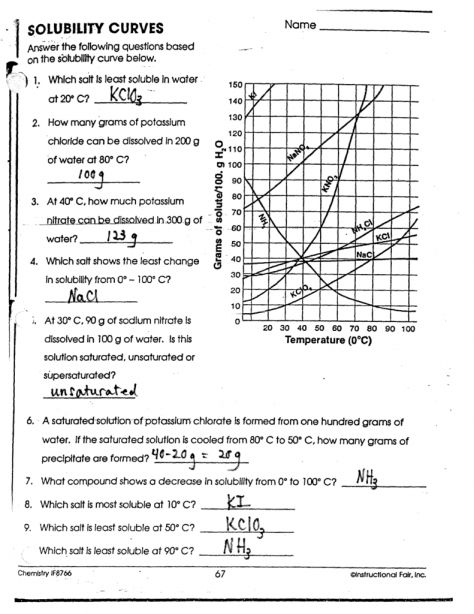
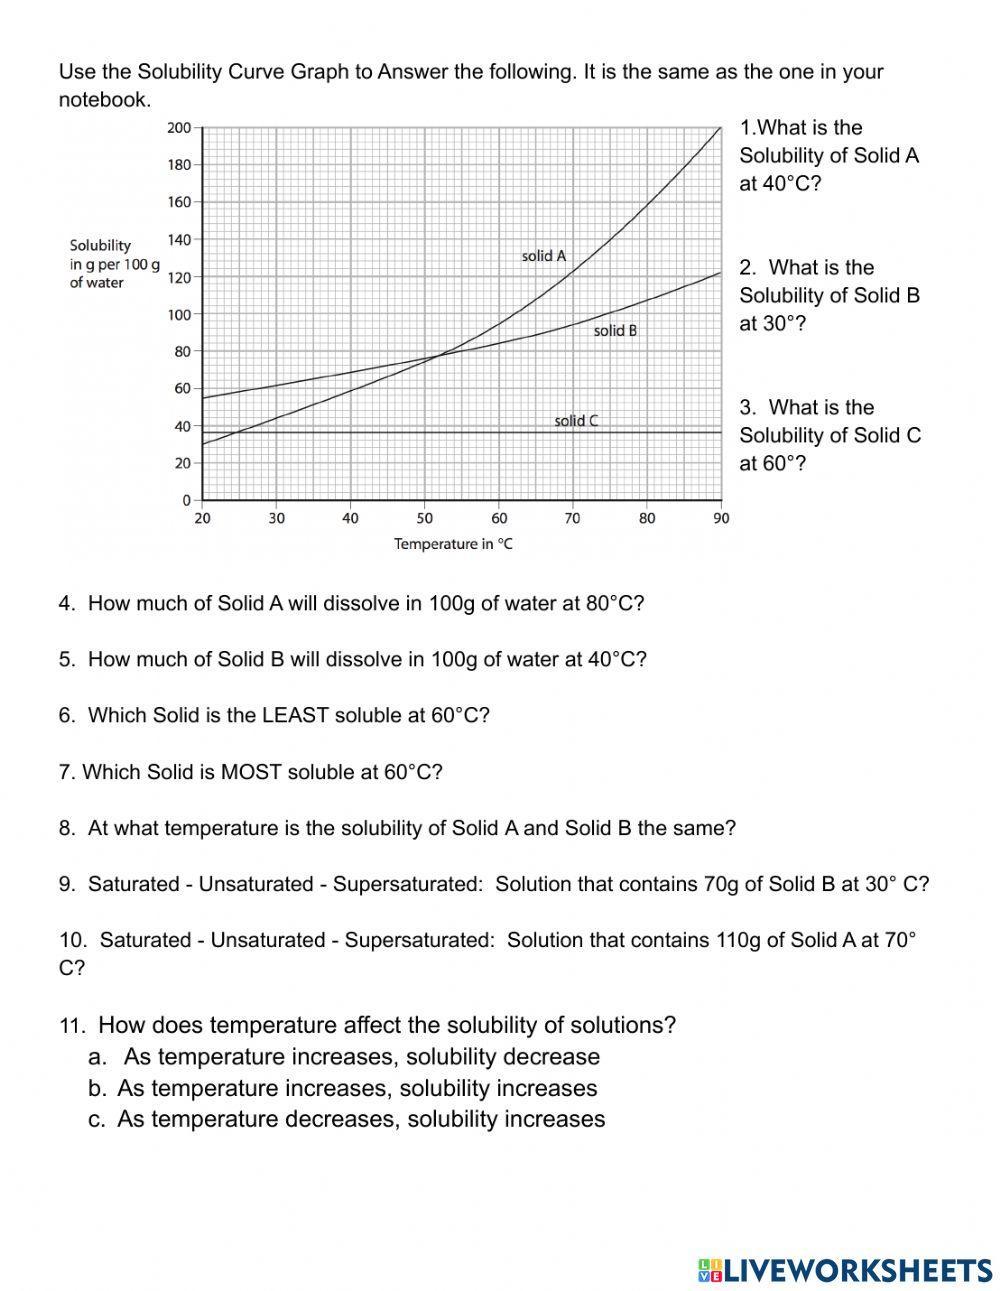
Understanding solubility graphs is a crucial aspect of chemistry, especially when dealing with solutions. Solubility graphs provide a visual representation of how the solubility of a substance changes with temperature. In this article, we’ll delve into the world of solubility graphs, explore how to read and interpret them, and provide a worksheet to help you practice.
What is a Solubility Graph?
A solubility graph is a graphical representation of the relationship between the solubility of a substance and temperature. It is typically a plot of solubility (in units of grams per 100 milliliters of solution) against temperature (in degrees Celsius). Solubility graphs can be used to predict the solubility of a substance at a given temperature.
How to Read a Solubility Graph
Reading a solubility graph is relatively straightforward. Here are the steps to follow:
- Identify the x-axis, which represents the temperature in degrees Celsius.
- Identify the y-axis, which represents the solubility in grams per 100 milliliters of solution.
- Locate the point on the graph that corresponds to the desired temperature.
- Read off the solubility value from the y-axis.
For example, if you want to know the solubility of a substance at 20°C, you would locate the point on the graph at 20°C on the x-axis and read off the corresponding solubility value from the y-axis.
Interpreting Solubility Graphs
Solubility graphs can provide valuable information about the solubility of a substance. Here are some key points to look out for:
- Increasing solubility: If the graph shows an increase in solubility with temperature, it means that the substance becomes more soluble as the temperature increases.
- Decreasing solubility: If the graph shows a decrease in solubility with temperature, it means that the substance becomes less soluble as the temperature increases.
- Constant solubility: If the graph shows a constant solubility over a range of temperatures, it means that the substance has a constant solubility regardless of temperature.
Solubility Graph Worksheet
Now that we’ve covered the basics of solubility graphs, it’s time to practice! Here’s a worksheet to help you get started:

| Temperature (°C) | Solubility (g/100mL) |
|---|---|
| 0 | 10 |
| 10 | 12 |
| 20 | 15 |
| 30 | 18 |
| 40 | 20 |
| 50 | 22 |
| 60 | 25 |
Using the data above, plot a solubility graph and answer the following questions:
- What is the solubility of the substance at 20°C?
- What is the solubility of the substance at 40°C?
- Does the solubility of the substance increase or decrease with temperature?
- What is the maximum solubility of the substance over the temperature range?
📝 Note: Make sure to label your axes correctly and plot the points accurately.
Solving Solubility Graph Problems
Here are some tips for solving solubility graph problems:
- Read the question carefully: Make sure you understand what the question is asking.
- Identify the key information: Look for the temperature and solubility values in the question.
- Use the graph to find the answer: Locate the point on the graph that corresponds to the desired temperature and read off the solubility value.
For example, if the question asks “What is the solubility of the substance at 30°C?”, you would locate the point on the graph at 30°C on the x-axis and read off the corresponding solubility value from the y-axis.
Conclusion
In this article, we’ve explored the world of solubility graphs and provided a worksheet to help you practice. By understanding how to read and interpret solubility graphs, you’ll be able to solve problems and make predictions about the solubility of substances. Remember to label your axes correctly, plot the points accurately, and use the graph to find the answers.
What is the purpose of a solubility graph?
+A solubility graph is used to predict the solubility of a substance at a given temperature.
How do I read a solubility graph?
+To read a solubility graph, identify the x-axis (temperature) and y-axis (solubility), locate the point on the graph that corresponds to the desired temperature, and read off the solubility value.
What does it mean if the solubility graph shows an increase in solubility with temperature?
+If the solubility graph shows an increase in solubility with temperature, it means that the substance becomes more soluble as the temperature increases.
Related Terms:
- Solubility graph Worksheet PDF
- Solubility graph Worksheet answers
- Solubility curve Worksheet PDF Answers
- Solubility Worksheet PDF
- Solubility curve questions and answers
- Solubility curve quiz


