5 Ways to Plot Numbers on a Number Line
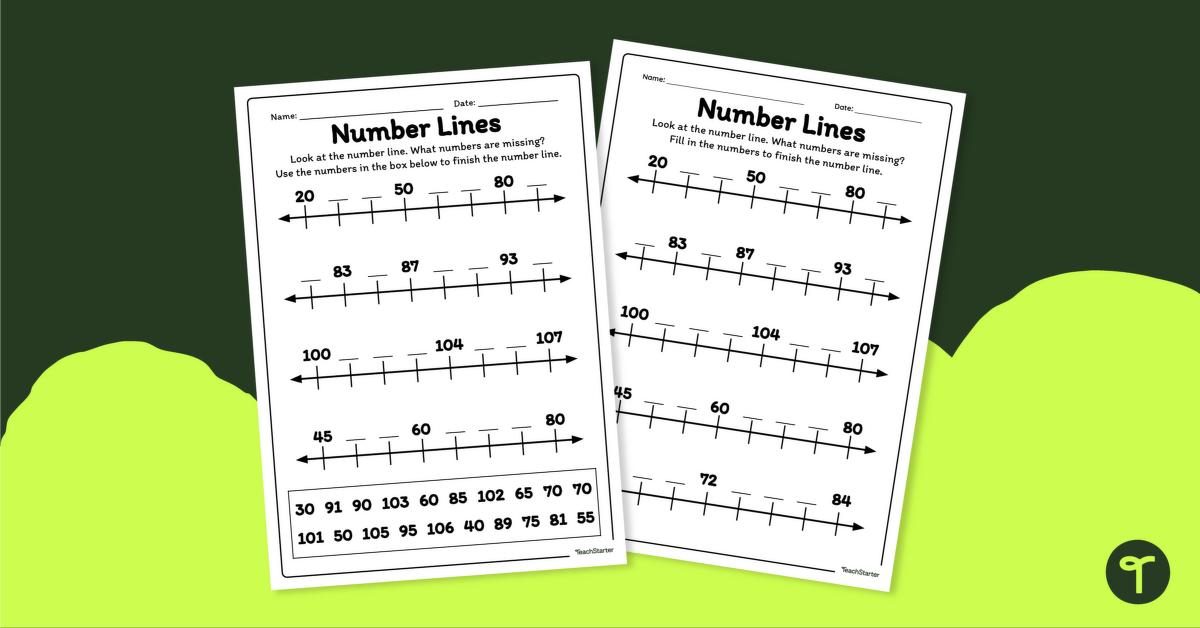
Understanding Number Lines
Number lines are a fundamental tool in mathematics, used to represent numbers in a visual format. They consist of a line with numbers marked at regular intervals, allowing users to compare and contrast different values. In this article, we will explore five ways to plot numbers on a number line, including basic plotting, comparing numbers, finding intervals, determining ranges, and visualizing negative numbers.
Method 1: Basic Plotting
The most basic way to plot numbers on a number line is to simply mark the number on the line. This is useful for visualizing individual numbers and understanding their relative position.
- Start with a number line marked with numbers at regular intervals (e.g., 0, 1, 2, 3, etc.).
- Choose a number to plot, such as 5.
- Find the corresponding point on the number line and mark it with a dot or a small line.
📝 Note: Make sure to label the point with the corresponding number (e.g., "5").
Method 2: Comparing Numbers
Number lines can also be used to compare two or more numbers. This method helps to determine which number is greater or lesser.
- Plot two numbers on the number line, such as 3 and 7.
- Observe which point is to the left or right of the other. In this case, 3 is to the left of 7, indicating that 3 is less than 7.
📝 Note: When comparing numbers, it's essential to ensure that the numbers are plotted on the same number line.
Method 3: Finding Intervals
Number lines can be used to find the interval between two numbers. This method is useful for calculating differences or ranges.
- Plot two numbers on the number line, such as 2 and 6.
- Count the number of units between the two points. In this case, there are 4 units between 2 and 6.
- The interval between 2 and 6 is 4.
📝 Note: When finding intervals, make sure to count the units between the points, not the points themselves.
Method 4: Determining Ranges
Number lines can also be used to determine the range of a set of numbers. This method helps to identify the smallest and largest values.
- Plot a set of numbers on the number line, such as 1, 3, 5, and 7.
- Identify the smallest and largest numbers in the set. In this case, the smallest number is 1, and the largest number is 7.
- The range is the difference between the largest and smallest numbers. In this case, the range is 6 (7 - 1 = 6).
📝 Note: When determining ranges, make sure to identify the smallest and largest numbers in the set.
Method 5: Visualizing Negative Numbers
Number lines can also be used to visualize negative numbers. This method helps to understand the concept of negative numbers and their relative position.
- Plot a number line with negative numbers marked at regular intervals (e.g., -3, -2, -1, 0, 1, 2, 3, etc.).
- Choose a negative number to plot, such as -4.
- Find the corresponding point on the number line and mark it with a dot or a small line.
📝 Note: When visualizing negative numbers, make sure to label the point with the corresponding number (e.g., "-4").
To recap, number lines are a versatile tool used to represent numbers in a visual format. By understanding how to plot numbers on a number line, we can compare numbers, find intervals, determine ranges, and visualize negative numbers.
What is a number line?
+A number line is a visual representation of numbers on a line, used to compare and contrast different values.
How do I plot a number on a number line?
+Plotting a number on a number line involves finding the corresponding point on the line and marking it with a dot or a small line.
What is the purpose of using number lines?
+The purpose of using number lines is to visualize numbers in a way that makes it easy to compare, contrast, and understand their relative position.
Related Terms:
- Number line worksheets PDF
