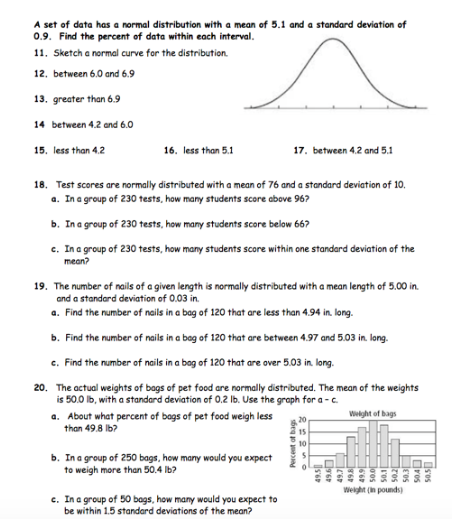
7 Ways to Master Normal Distribution

Understanding Normal Distribution
Normal distribution, also known as the Gaussian distribution, is a fundamental concept in statistics and data analysis. It is a probability distribution that is symmetric about the mean, showing that data near the mean are more frequent in occurrence than data far from the mean. In this article, we will explore seven ways to master normal distribution, including its definition, properties, and applications.
What is Normal Distribution?
Normal distribution is a continuous probability distribution that is characterized by its mean (μ) and standard deviation (σ). The mean is the average value of the data, while the standard deviation is a measure of the spread or dispersion of the data. The normal distribution is bell-shaped, with the majority of the data points clustered around the mean.
Properties of Normal Distribution
The normal distribution has several important properties that make it a useful tool for data analysis:
- Symmetry: The normal distribution is symmetric about the mean, meaning that the left and right sides of the distribution are mirror images of each other.
- Bell-shaped: The normal distribution is characterized by its bell-shaped curve, which indicates that the majority of the data points are clustered around the mean.
- Mean, median, and mode: The mean, median, and mode of a normal distribution are all equal.
- Standard deviation: The standard deviation of a normal distribution is a measure of the spread or dispersion of the data.
Applications of Normal Distribution
The normal distribution has numerous applications in various fields, including:
- Statistics: Normal distribution is used in statistical inference, hypothesis testing, and confidence intervals.
- Data analysis: Normal distribution is used to analyze and interpret data in various fields, including business, economics, and medicine.
- Engineering: Normal distribution is used in engineering to model and analyze complex systems.
- Finance: Normal distribution is used in finance to model and analyze financial data, such as stock prices and returns.
7 Ways to Master Normal Distribution
Here are seven ways to master normal distribution:
1. Understand the 68-95-99.7 Rule
The 68-95-99.7 rule, also known as the empirical rule, states that about 68% of the data falls within one standard deviation of the mean, about 95% falls within two standard deviations, and about 99.7% falls within three standard deviations.
2. Use the Z-Score Formula
The Z-score formula is used to convert a raw score to a standardized score, which can be used to compare data points from different normal distributions. The Z-score formula is:
Z = (X - μ) / σ
where X is the raw score, μ is the mean, and σ is the standard deviation.
3. Learn to Calculate Probabilities
To master normal distribution, you need to learn how to calculate probabilities using the normal distribution curve. You can use a standard normal distribution table (also known as a Z-table) or a calculator to calculate probabilities.
4. Understand the Central Limit Theorem
The central limit theorem states that the distribution of the mean of a large sample of independent and identically distributed random variables will be approximately normal, even if the underlying distribution is not normal.
5. Practice with Real-World Examples
Practice is key to mastering normal distribution. Use real-world examples, such as exam scores, heights, or stock prices, to practice calculating probabilities and understanding the properties of normal distribution.
6. Learn to Identify Normal Distribution
Learn to identify normal distribution by looking for the following characteristics:
- Bell-shaped curve: The data should be distributed in a bell-shaped curve, with the majority of the data points clustered around the mean.
- Symmetry: The data should be symmetric about the mean, meaning that the left and right sides of the distribution are mirror images of each other.
7. Use Technology to Visualize Normal Distribution
Use technology, such as graphing calculators or statistical software, to visualize normal distribution and explore its properties.
📝 Note: Mastering normal distribution takes time and practice. Start by understanding the properties and applications of normal distribution, and then practice with real-world examples.
To summarize, mastering normal distribution requires understanding its definition, properties, and applications. By following these seven steps, you can become proficient in using normal distribution to analyze and interpret data.
What is the 68-95-99.7 rule?
+
The 68-95-99.7 rule, also known as the empirical rule, states that about 68% of the data falls within one standard deviation of the mean, about 95% falls within two standard deviations, and about 99.7% falls within three standard deviations.
What is the Z-score formula?
+
The Z-score formula is Z = (X - μ) / σ, where X is the raw score, μ is the mean, and σ is the standard deviation.
What is the central limit theorem?
+
The central limit theorem states that the distribution of the mean of a large sample of independent and identically distributed random variables will be approximately normal, even if the underlying distribution is not normal.
Related Terms:
- Normal distribution Worksheet PDF
- Normal distribution Worksheet Kuta
- Normal distribution Worksheet doc
- Normal distribution PDF
- Normal distribution exercises


