7 Ways to Master Graphs of Linear Functions

Understanding Linear Functions
Linear functions are a fundamental concept in mathematics, particularly in algebra. They represent a relationship between two variables, where one variable changes in proportion to the other. Graphs of linear functions are used to visualize this relationship, making it easier to analyze and interpret the data. Mastering graphs of linear functions is essential for solving problems in various fields, including physics, engineering, economics, and computer science.
What are Linear Functions?
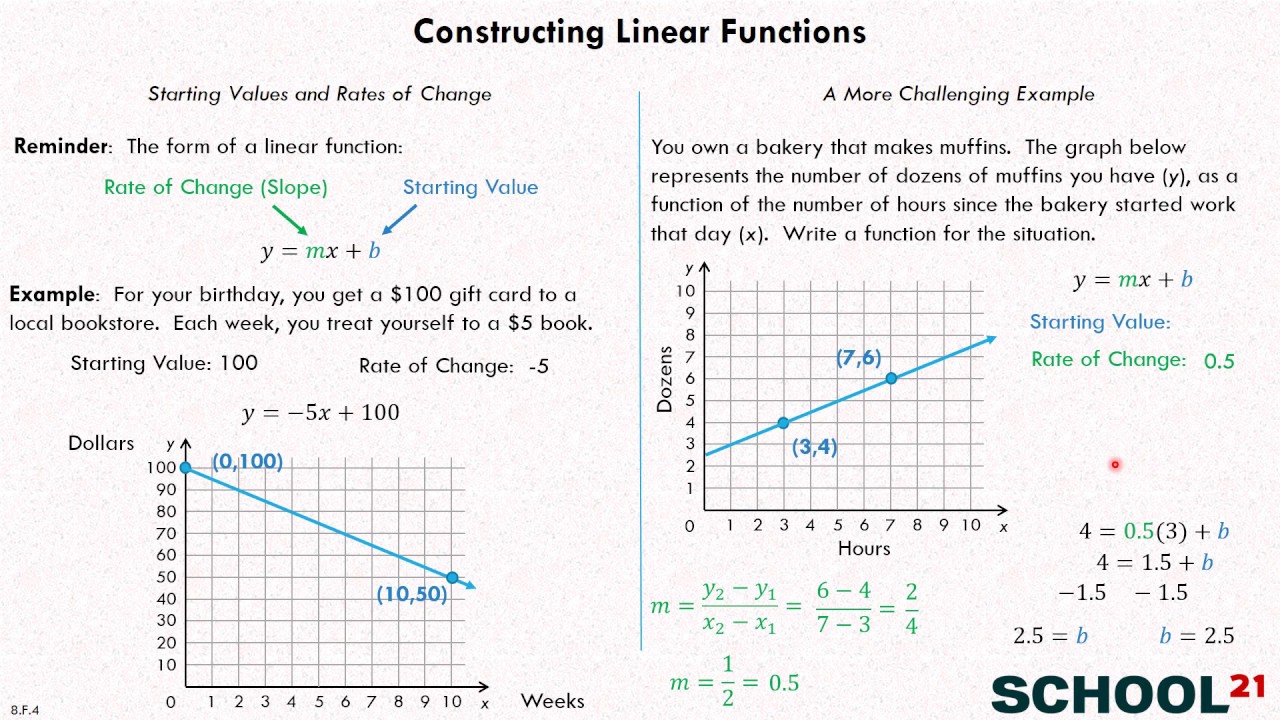
A linear function is a polynomial function of degree one, which means the highest power of the variable is one. It can be represented in the form of f(x) = mx + b, where:
- m is the slope or gradient of the line
- b is the y-intercept or the point where the line crosses the y-axis
- x is the independent variable
For example, the linear function f(x) = 2x + 3 has a slope of 2 and a y-intercept of 3.
How to Graph Linear Functions
Graphing linear functions involves plotting points on a coordinate plane and drawing a straight line through them. Here are the steps to graph a linear function:
- Step 1: Identify the slope (m) and y-intercept (b) of the linear function.
- Step 2: Plot the y-intercept (b) on the y-axis.
- Step 3: Use the slope (m) to find the next point on the line. For example, if the slope is 2, move 2 units up and 1 unit right from the y-intercept.
- Step 4: Plot the next point on the line.
- Step 5: Draw a straight line through the two points.
📝 Note: You can also use a graphing calculator or online tools to graph linear functions.
7 Tips to Master Graphs of Linear Functions
Here are seven tips to help you master graphs of linear functions:
1. Understand the Slope-Intercept Form
The slope-intercept form of a linear function is f(x) = mx + b. Understanding this form is essential for graphing linear functions. The slope (m) tells you how steep the line is, and the y-intercept (b) tells you where the line crosses the y-axis.
2. Identify the X-Intercept
The x-intercept is the point where the line crosses the x-axis. To find the x-intercept, set y = 0 and solve for x. This will give you the x-coordinate of the x-intercept.
3. Use a Table of Values
Creating a table of values can help you graph a linear function. Choose several x-values and calculate the corresponding y-values using the linear function. Then, plot the points on a coordinate plane and draw a straight line through them.
4. Graphing Linear Functions with a Negative Slope
When graphing a linear function with a negative slope, the line will slope downward from left to right. For example, the linear function f(x) = -2x + 3 has a negative slope.
5. Graphing Linear Functions with a Zero Slope
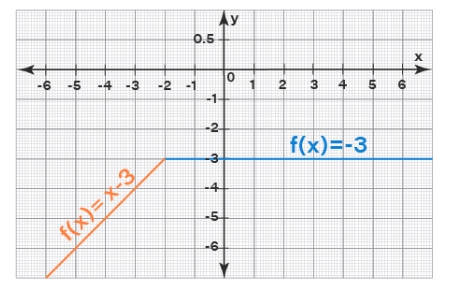
When graphing a linear function with a zero slope, the line will be horizontal. For example, the linear function f(x) = 3 has a zero slope.
6. Graphing Linear Functions with a Undefined Slope
When graphing a linear function with an undefined slope, the line will be vertical. For example, the linear function f(x) = x + 2 has an undefined slope.
7. Practice, Practice, Practice
Practice graphing different types of linear functions, including those with positive and negative slopes, zero slopes, and undefined slopes. The more you practice, the more comfortable you will become with graphing linear functions.

| Slope | Y-Intercept | Graph |
|---|---|---|
| Positive (m > 0) | b | A line that slopes upward from left to right |
| Negative (m < 0) | b | A line that slopes downward from left to right |
| Zero (m = 0) | b | A horizontal line |
| Undefined (m is undefined) | b | A vertical line |
Mastering graphs of linear functions takes time and practice. By following these seven tips, you can improve your understanding of linear functions and become more proficient in graphing them.
To become proficient in graphing linear functions, it is essential to practice regularly and apply the concepts to real-world problems. With time and practice, you will become more comfortable graphing linear functions and be able to solve problems with ease.
What is the slope-intercept form of a linear function?
+The slope-intercept form of a linear function is f(x) = mx + b, where m is the slope and b is the y-intercept.
How do you graph a linear function with a negative slope?
+To graph a linear function with a negative slope, plot the y-intercept and then move downward and to the right to find the next point on the line.
What is the x-intercept of a linear function?
+The x-intercept is the point where the line crosses the x-axis. To find the x-intercept, set y = 0 and solve for x.
Related Terms:
- Modeling Linear Functions worksheet
- Graphing Functions Worksheet pdf
- Linear function Word Problems worksheet


