Graphing Using Intercepts Made Easy Worksheet

Mastering Graphing Using Intercepts: A Comprehensive Guide
Graphing using intercepts is a fundamental concept in mathematics, particularly in algebra and coordinate geometry. It involves using the x-intercepts and y-intercepts of a function to graph it on a coordinate plane. In this article, we will explore the concept of graphing using intercepts, its importance, and provide a step-by-step guide on how to do it.
What are Intercepts?
In the context of graphing, an intercept is a point where a line or curve crosses the x-axis or y-axis. There are two types of intercepts:
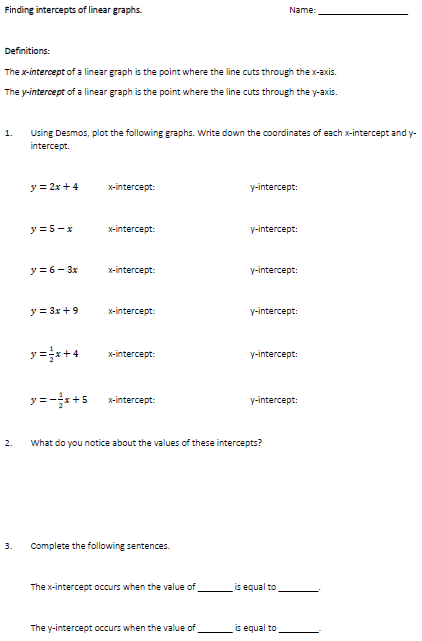
- X-intercept: The point where a line or curve crosses the x-axis. It is the value of x when y is equal to zero.
- Y-intercept: The point where a line or curve crosses the y-axis. It is the value of y when x is equal to zero.
Why is Graphing Using Intercepts Important?
Graphing using intercepts is an essential skill in mathematics, particularly in algebra and coordinate geometry. It helps students to:
- Understand the behavior of functions: By graphing functions using intercepts, students can visualize how the function behaves as x and y values change.
- Solve equations: Graphing using intercepts can help students solve equations by finding the points where the graph crosses the x-axis or y-axis.
- Analyze data: In real-world applications, graphing using intercepts can help analyze data and make informed decisions.
How to Graph Using Intercepts: A Step-by-Step Guide
Graphing using intercepts is a straightforward process that involves the following steps:
- Step 1: Identify the X-Intercepts
- To find the x-intercepts, set y equal to zero and solve for x.
- Write the x-intercepts as points on the coordinate plane (x, 0).
- Step 2: Identify the Y-Intercepts
- To find the y-intercepts, set x equal to zero and solve for y.
- Write the y-intercepts as points on the coordinate plane (0, y).
- Step 3: Plot the Intercepts
- Plot the x-intercepts and y-intercepts on the coordinate plane.
- Use a ruler to draw a line through the intercepts.
- Step 4: Check the Graph
- Verify that the graph is correct by checking that it passes through the intercepts.
- Use a calculator or computer software to graph the function and verify the results.
📝 Note: Make sure to label the x-intercepts and y-intercepts clearly on the graph.
Example: Graphing a Linear Function Using Intercepts
Suppose we want to graph the linear function f(x) = 2x + 3 using intercepts.
- Step 1: Identify the X-Intercepts
- Set y equal to zero and solve for x: 2x + 3 = 0 –> x = -3⁄2
- Write the x-intercept as a point on the coordinate plane: (-3⁄2, 0)
- Step 2: Identify the Y-Intercepts
- Set x equal to zero and solve for y: f(0) = 3
- Write the y-intercept as a point on the coordinate plane: (0, 3)
- Step 3: Plot the Intercepts
- Plot the x-intercept and y-intercept on the coordinate plane.
- Use a ruler to draw a line through the intercepts.

| x | y | |
|---|---|---|
| X-Intercept | -3⁄2 | 0 |
| Y-Intercept | 0 | 3 |
📝 Note: Make sure to check the graph to ensure that it passes through the intercepts.
Conclusion
Graphing using intercepts is a fundamental concept in mathematics that helps students understand the behavior of functions, solve equations, and analyze data. By following the step-by-step guide outlined in this article, students can master the skill of graphing using intercepts and become proficient in mathematics.
FAQs
What is the x-intercept of a function?
+
The x-intercept of a function is the point where the graph crosses the x-axis. It is the value of x when y is equal to zero.
How do I find the y-intercept of a function?
+
To find the y-intercept of a function, set x equal to zero and solve for y.
What is the importance of graphing using intercepts?
+
Graphing using intercepts helps students understand the behavior of functions, solve equations, and analyze data.


