Graphing Inverse Functions Made Easy with This Worksheet

Unlocking the Secrets of Inverse Functions: A Comprehensive Guide
Inverse functions are a fundamental concept in mathematics, and graphing them can be a daunting task for many students. However, with the right approach and tools, understanding and graphing inverse functions can become a breeze. In this article, we will delve into the world of inverse functions, explore their properties, and provide a step-by-step guide on how to graph them using a worksheet.
What are Inverse Functions?
Inverse functions are functions that reverse the operation of the original function. In other words, if a function f(x) maps an input x to an output y, then the inverse function f^{-1}(x) maps the input y back to the original input x. This concept is crucial in various mathematical fields, such as algebra, calculus, and geometry.
Properties of Inverse Functions
Inverse functions have several important properties that make them useful in mathematical modeling and problem-solving:
- One-to-one correspondence: Inverse functions have a one-to-one correspondence between their inputs and outputs. This means that each input corresponds to a unique output, and vice versa.
- Reversibility: Inverse functions can be composed with the original function to get the original input back.
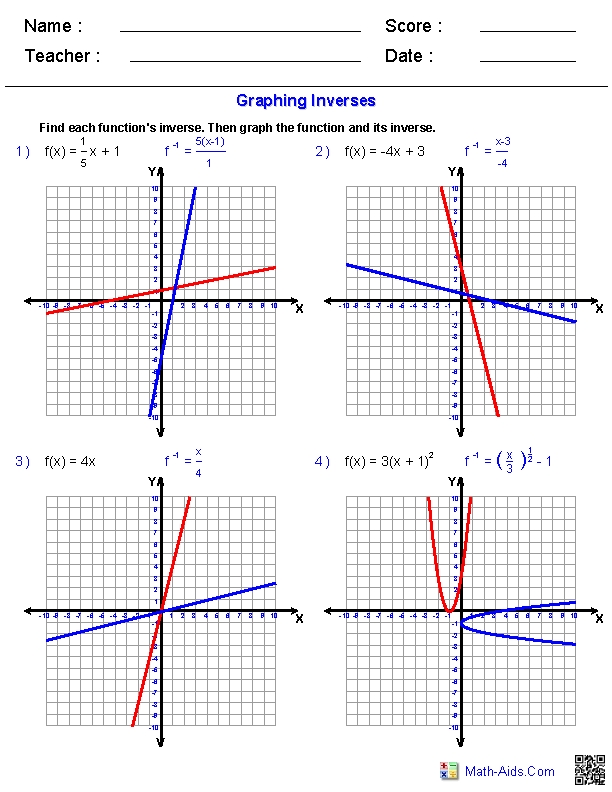
- Symmetry: The graph of an inverse function is symmetric to the graph of the original function with respect to the line y = x.
How to Graph Inverse Functions
Graphing inverse functions can be done using a simple worksheet. Here’s a step-by-step guide:
- Start with the original function: Begin by graphing the original function f(x) on a coordinate plane.
- Find the inverse function: Find the inverse function f^{-1}(x) by switching the x and y variables in the original function.
- Reflect the graph: Reflect the graph of the original function across the line y = x to get the graph of the inverse function.
- Verify the symmetry: Verify that the graph of the inverse function is symmetric to the graph of the original function with respect to the line y = x.

| Original Function | Inverse Function |
|---|---|
| f(x) = 2x + 1 | f^{-1}(x) = (x - 1)/2 |
| f(x) = x^2 | f^{-1}(x) = ±√x |
📝 Note: When finding the inverse function, make sure to switch the x and y variables correctly.
Common Mistakes to Avoid
When graphing inverse functions, there are several common mistakes to avoid:
- Incorrectly switching x and y variables: Make sure to switch the x and y variables correctly when finding the inverse function.
- Not reflecting the graph correctly: Reflect the graph of the original function across the line y = x to get the graph of the inverse function.
- Not verifying symmetry: Verify that the graph of the inverse function is symmetric to the graph of the original function with respect to the line y = x.
By following these steps and avoiding common mistakes, you can become proficient in graphing inverse functions using a worksheet.
In conclusion, graphing inverse functions is a fundamental skill in mathematics that can be mastered with practice and patience. By understanding the properties of inverse functions and following a step-by-step guide, you can become confident in your ability to graph them. Remember to avoid common mistakes and verify the symmetry of the graph to ensure accuracy.
What is the difference between a function and its inverse?
+A function maps an input to an output, while its inverse maps the output back to the original input.
How do I find the inverse of a function?
+Switch the x and y variables in the original function to find the inverse function.
Why is graphing inverse functions important?
+Graphing inverse functions is crucial in mathematical modeling and problem-solving, as it helps to understand the relationships between variables.


