Graphing Inequalities on a Number Line Made Easy
Understanding Inequalities on a Number Line
Graphing inequalities on a number line can seem daunting at first, but with a solid understanding of the basics, you’ll be able to visualize and solve these types of problems with ease. In this article, we’ll break down the concept of inequalities on a number line, providing you with a comprehensive guide to graphing and solving them.
What are Inequalities?
Inequalities are statements that compare two expressions using greater than (≥), less than (<), greater than or equal to (≥), or less than or equal to (≤) symbols. For example:
2x + 3 > 5
This inequality states that the expression 2x + 3 is greater than 5.
Graphing Inequalities on a Number Line
To graph an inequality on a number line, you need to follow these steps:
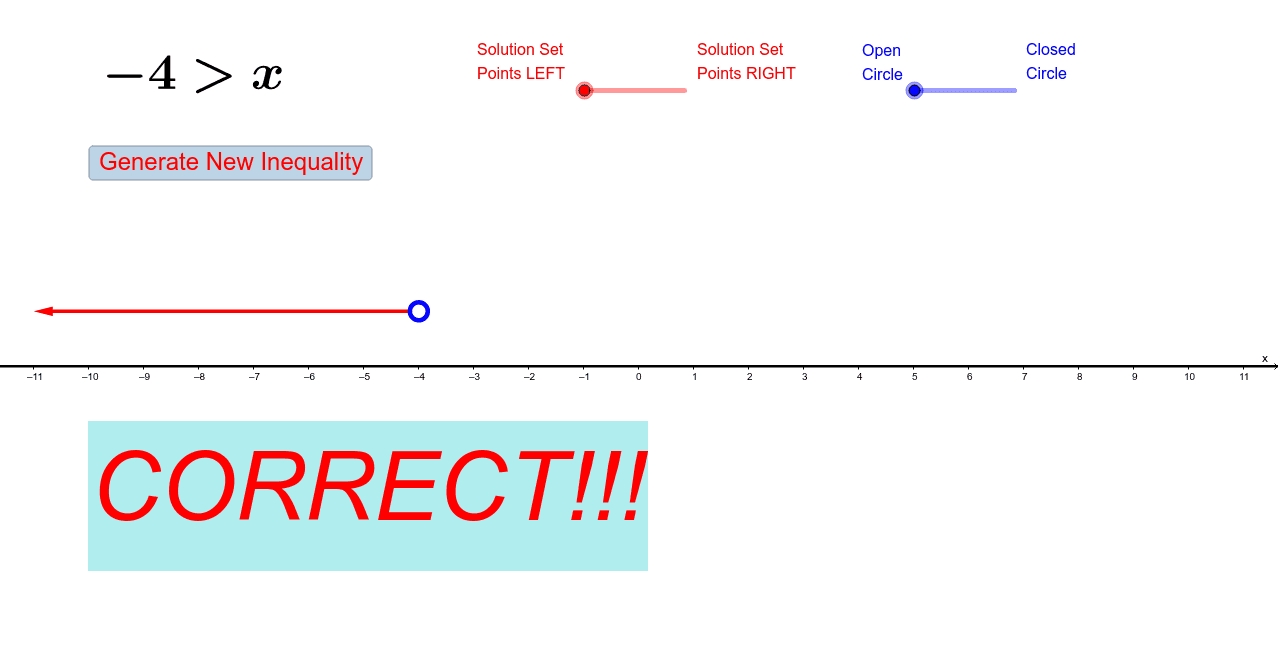
- Determine the direction of the inequality: Look at the inequality symbol to determine the direction of the inequality. If the symbol is ≥ or >, the inequality opens to the right. If the symbol is ≤ or <, the inequality opens to the left.
- Find the boundary point: The boundary point is the value that divides the number line into two parts. To find the boundary point, solve the inequality as an equation.
- Graph the boundary point: Plot the boundary point on the number line. If the inequality symbol is ≥ or ≤, draw a closed circle (•) at the boundary point. If the symbol is > or <, draw an open circle (○) at the boundary point.
- Shade the solution region: Based on the direction of the inequality, shade the region on the number line that satisfies the inequality.
Example 1:
Solve the inequality 2x + 3 > 5 and graph it on a number line.
Step 1: Determine the direction of the inequality. The symbol is >, so the inequality opens to the right.
Step 2: Find the boundary point. Solve the inequality as an equation:
2x + 3 = 5
Subtract 3 from both sides:
2x = 2
Divide both sides by 2:
x = 1
Step 3: Graph the boundary point. Since the inequality symbol is >, draw an open circle (○) at x = 1.
Step 4: Shade the solution region. Since the inequality opens to the right, shade the region to the right of the boundary point.
 |
Special Cases: Compound Inequalities
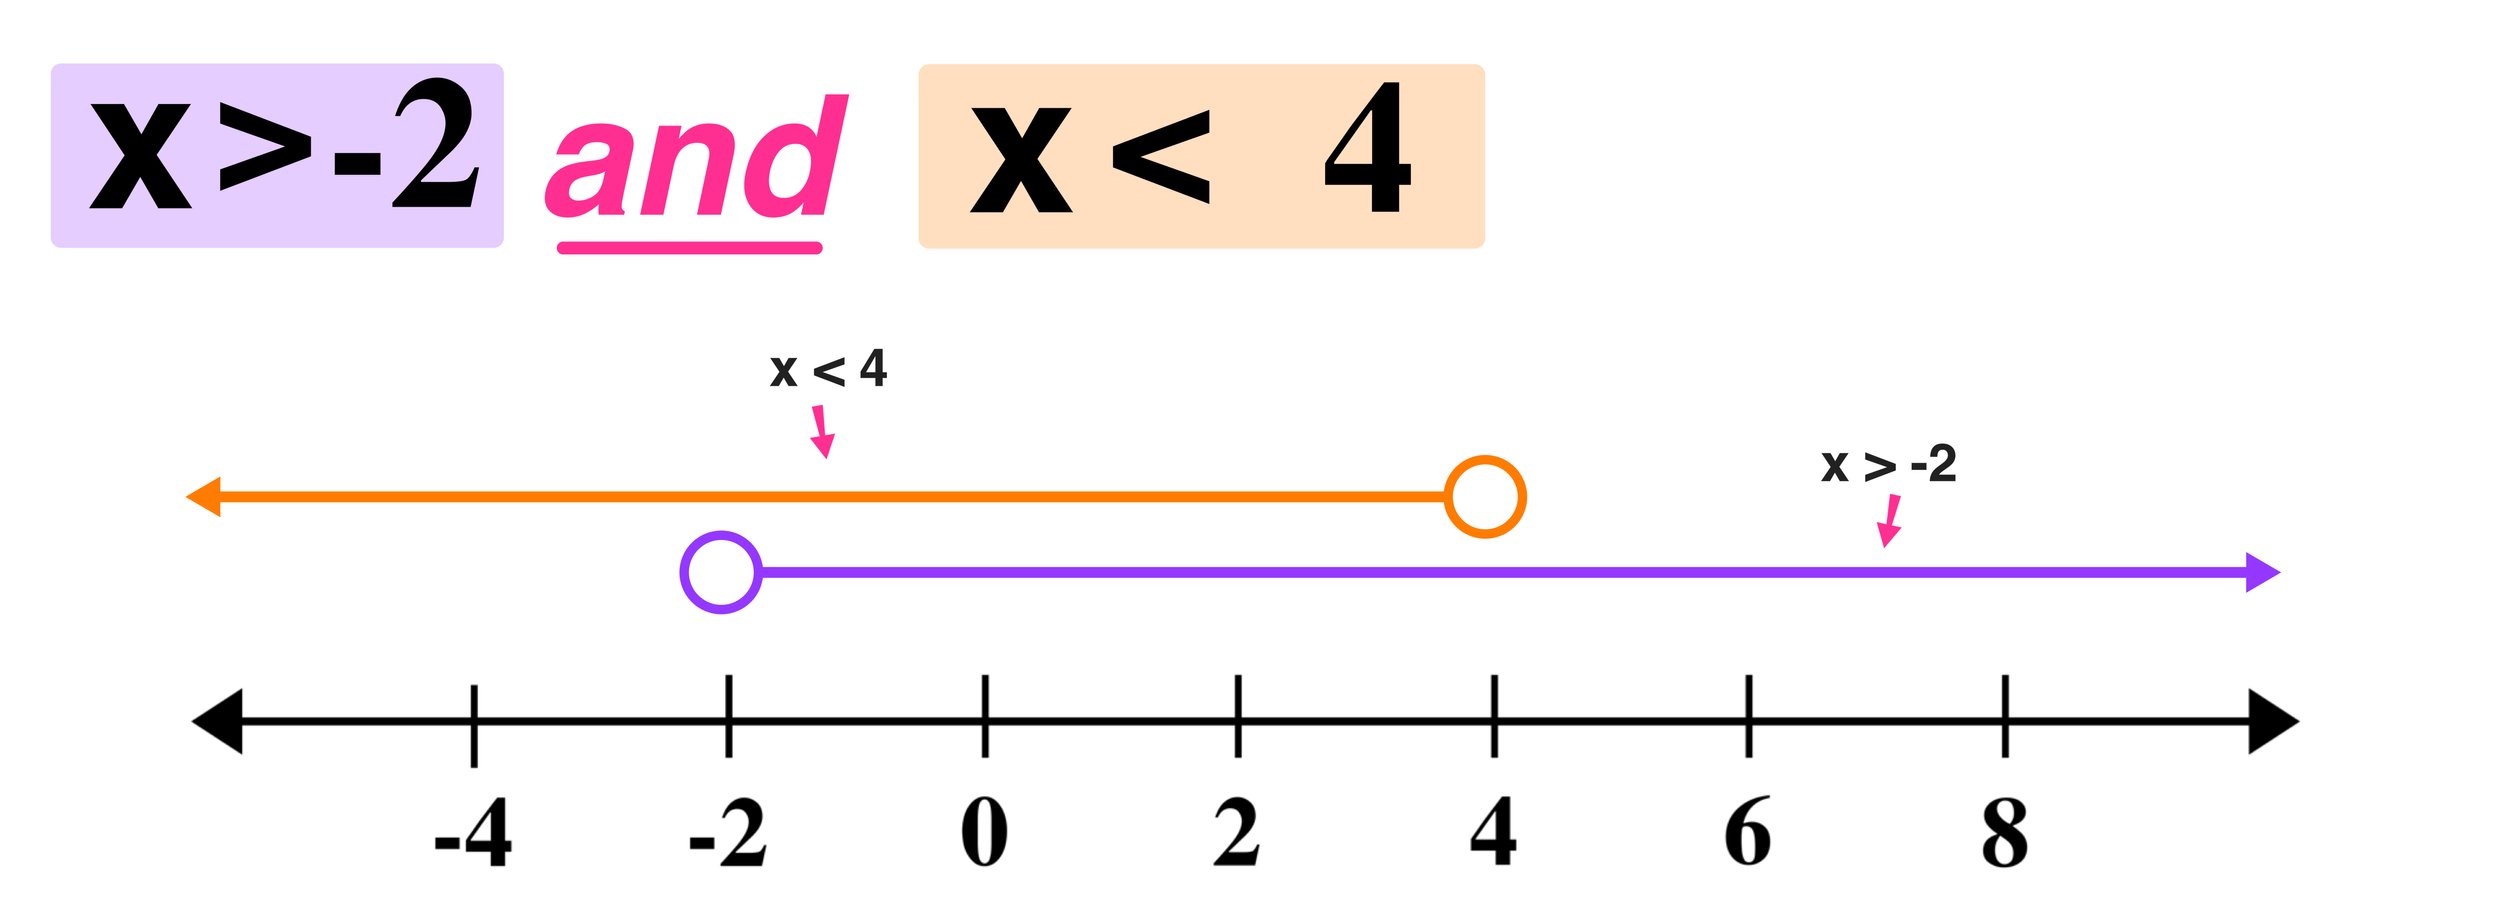
Compound inequalities involve two or more inequalities joined by the word “and” or “or”. To graph compound inequalities, follow these steps:
- Graph each inequality separately: Graph each inequality on the same number line, using the steps above.
- Combine the solution regions: If the compound inequality is an “and” inequality, shade the region where the two solution regions overlap. If the compound inequality is an “or” inequality, shade the entire region where either solution region lies.
Example 2:
Solve the compound inequality -2 < x < 3 and graph it on a number line.
Step 1: Graph each inequality separately.
- -2 < x: Graph the inequality, shading the region to the right of the boundary point x = -2.
- x < 3: Graph the inequality, shading the region to the left of the boundary point x = 3.
Step 2: Combine the solution regions. Since this is an “and” inequality, shade the region where the two solution regions overlap.
 |
Conclusion
Graphing inequalities on a number line requires a solid understanding of the basics. By following the steps outlined above, you’ll be able to visualize and solve inequalities with ease. Remember to determine the direction of the inequality, find the boundary point, graph the boundary point, and shade the solution region.
What is the difference between a closed circle and an open circle on a number line?
+A closed circle (•) indicates that the boundary point is included in the solution region, while an open circle (○) indicates that the boundary point is not included.
How do I graph a compound inequality on a number line?
+Graph each inequality separately, then combine the solution regions. If the compound inequality is an “and” inequality, shade the region where the two solution regions overlap. If the compound inequality is an “or” inequality, shade the entire region where either solution region lies.
What is the boundary point of an inequality?
+The boundary point is the value that divides the number line into two parts. To find the boundary point, solve the inequality as an equation.
