Graph Inequalities on a Number Line Made Easy

Graphing Inequalities on a Number Line: A Step-by-Step Guide
Graphing inequalities on a number line can seem daunting at first, but with a few simple steps, you’ll be a pro in no time! In this article, we’ll walk you through the process of graphing inequalities on a number line, and provide you with some valuable tips and tricks to make it easier.
What is an Inequality?
Before we dive into graphing inequalities, let’s quickly review what an inequality is. An inequality is a statement that compares two expressions using one of the following symbols:
- Less than (<)
- Greater than (>)
- Less than or equal to (≤)
- Greater than or equal to (≥)
For example: 2x + 3 > 5
How to Graph an Inequality on a Number Line
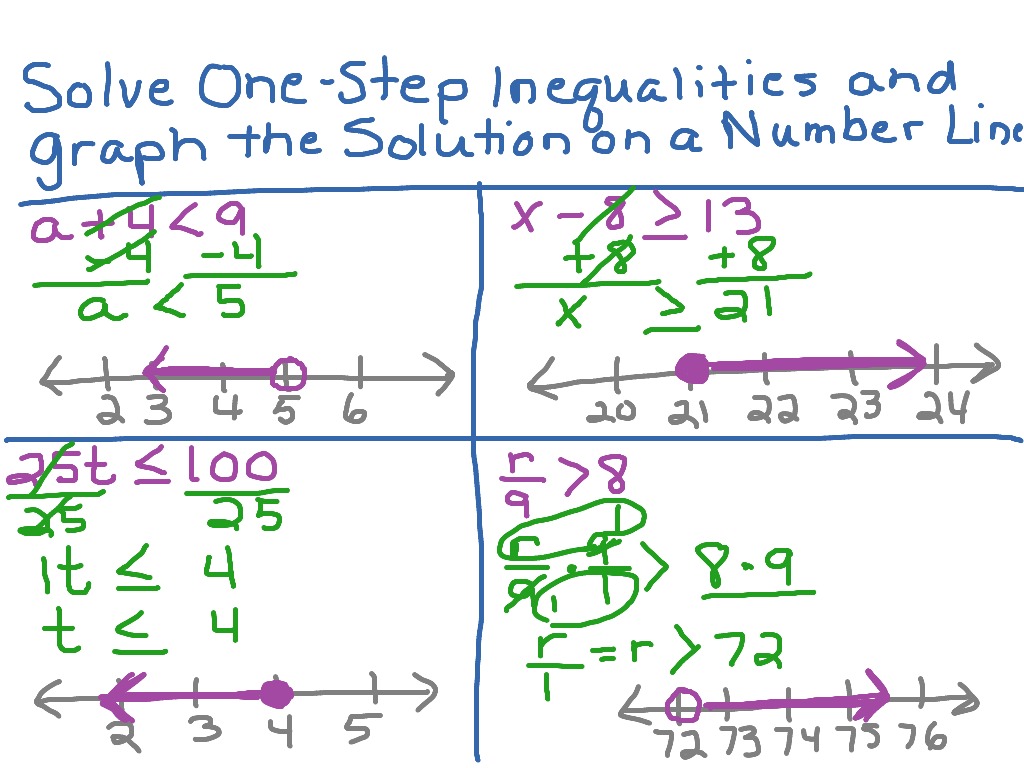
Graphing an inequality on a number line involves identifying the solution set of the inequality, which is the set of all values that make the inequality true. Here’s a step-by-step guide to graphing inequalities:
- Solve the Inequality: Start by solving the inequality for x. For example, if the inequality is 2x + 3 > 5, subtract 3 from both sides to get 2x > 2, and then divide both sides by 2 to get x > 1.
- Determine the Direction of the Inequality: Look at the direction of the inequality symbol. If the symbol is < or ≤, the solution set will be to the left of the boundary point. If the symbol is > or ≥, the solution set will be to the right of the boundary point.
- Plot the Boundary Point: Plot the boundary point on the number line. This is the point that separates the solution set from the non-solution set.
- Shade the Solution Set: Shade the solution set on the number line. If the solution set is to the left of the boundary point, shade to the left. If the solution set is to the right of the boundary point, shade to the right.
- Check the Endpoints: Check the endpoints of the solution set to see if they are included or excluded. If the inequality symbol is < or >, the endpoints are excluded. If the inequality symbol is ≤ or ≥, the endpoints are included.
Examples of Graphing Inequalities
Let’s look at a few examples of graphing inequalities on a number line.
Example 1: x + 2 > 5
- Solve the inequality: x > 3
- Determine the direction of the inequality: The solution set is to the right of the boundary point.
- Plot the boundary point: 3
- Shade the solution set: Shade to the right of 3.
- Check the endpoints: The endpoint 3 is excluded.
Example 2: 2x - 1 ≤ 7
- Solve the inequality: x ≤ 4
- Determine the direction of the inequality: The solution set is to the left of the boundary point.
- Plot the boundary point: 4
- Shade the solution set: Shade to the left of 4.
- Check the endpoints: The endpoint 4 is included.
Tips and Tricks for Graphing Inequalities
Here are a few tips and tricks to make graphing inequalities easier:
- Use a Number Line: Always use a number line to graph inequalities. This will help you visualize the solution set and make it easier to identify the boundary point.
- Check the Endpoints: Always check the endpoints of the solution set to see if they are included or excluded.
- Use Different Colors: Use different colors to shade the solution set and the non-solution set. This will help you distinguish between the two sets.
- Practice, Practice, Practice: The more you practice graphing inequalities, the easier it will become.
📝 Note: When graphing inequalities, make sure to label the number line clearly and include the inequality symbol.
Common Mistakes to Avoid
Here are a few common mistakes to avoid when graphing inequalities:
- Reversing the Inequality Symbol: Make sure to keep the inequality symbol in the correct direction. If the inequality symbol is < or ≤, the solution set will be to the left of the boundary point. If the inequality symbol is > or ≥, the solution set will be to the right of the boundary point.
- Forgetting to Check the Endpoints: Always check the endpoints of the solution set to see if they are included or excluded.
- Shading the Wrong Set: Make sure to shade the correct set on the number line. If the solution set is to the left of the boundary point, shade to the left. If the solution set is to the right of the boundary point, shade to the right.
What is the difference between an inequality and an equation?
+An inequality is a statement that compares two expressions using one of the following symbols: <, >, ≤, or ≥. An equation is a statement that says two expressions are equal.
How do I know which direction to shade on a number line?
+If the inequality symbol is < or ≤, shade to the left of the boundary point. If the inequality symbol is > or ≥, shade to the right of the boundary point.
What is the boundary point on a number line?
+The boundary point is the point that separates the solution set from the non-solution set. It is the point where the inequality symbol changes direction.
In conclusion, graphing inequalities on a number line is a simple process that involves solving the inequality, determining the direction of the inequality, plotting the boundary point, shading the solution set, and checking the endpoints. By following these steps and using the tips and tricks outlined in this article, you’ll be able to graph inequalities with ease. Remember to practice regularly to become more comfortable with graphing inequalities, and don’t be afraid to ask for help if you need it!


