Mastering Distance vs Time Graphs with Ease
Understanding the Basics of Distance vs Time Graphs
Distance vs time graphs are a fundamental concept in physics and mathematics, used to describe the motion of objects. These graphs plot the distance traveled by an object against the time taken, providing valuable insights into the object’s speed, velocity, and acceleration. In this article, we will delve into the world of distance vs time graphs, exploring their significance, types, and how to interpret them with ease.
Why Distance vs Time Graphs are Important
Distance vs time graphs are essential in various fields, including physics, engineering, and mathematics. They help us:
- Analyze the motion of objects, including their speed, velocity, and acceleration
- Understand the relationship between distance and time
- Identify patterns and trends in an object’s motion
- Make predictions about an object’s future motion
Types of Distance vs Time Graphs
There are several types of distance vs time graphs, each with its own unique characteristics.
- Uniform Motion Graphs: These graphs represent an object moving at a constant speed. The graph is a straight line, with a constant slope.
- Non-Uniform Motion Graphs: These graphs represent an object moving at a non-constant speed. The graph is a curved line, with a changing slope.
- Motion with Acceleration Graphs: These graphs represent an object moving with acceleration. The graph is a curved line, with a changing slope.
Interpreting Distance vs Time Graphs
Interpreting distance vs time graphs requires attention to detail and a clear understanding of the underlying concepts. Here are some key points to consider:
- Distance: The distance traveled by an object is represented on the y-axis.
- Time: The time taken by an object to travel a certain distance is represented on the x-axis.
- Speed: The speed of an object can be calculated by finding the slope of the graph.
- Velocity: The velocity of an object can be calculated by finding the slope of the graph and taking into account the direction of motion.
- Acceleration: The acceleration of an object can be calculated by finding the rate of change of velocity.
Example: Interpreting a Uniform Motion Graph
Suppose we have a distance vs time graph representing an object moving at a constant speed. The graph is a straight line, with a constant slope.
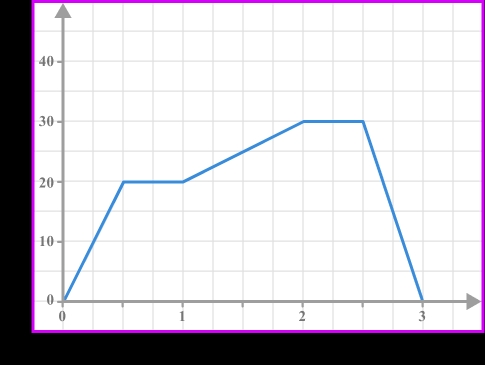
| Time (s) | Distance (m) |
|---|---|
| 0 | 0 |
| 2 | 10 |
| 4 | 20 |
| 6 | 30 |
From this graph, we can calculate the speed of the object by finding the slope:
Speed = Distance / Time = 10 m / 2 s = 5 m/s
Common Mistakes to Avoid
When working with distance vs time graphs, it’s essential to avoid common mistakes, including:
- Incorrect axis labels: Make sure to label the axes correctly, with distance on the y-axis and time on the x-axis.
- Incorrect slope calculation: Make sure to calculate the slope correctly, taking into account the units of distance and time.
- Ignoring the direction of motion: Make sure to take into account the direction of motion when calculating velocity.
🔍 Note: When working with distance vs time graphs, it's essential to pay attention to the units of distance and time, as well as the direction of motion.
Real-World Applications of Distance vs Time Graphs
Distance vs time graphs have numerous real-world applications, including:
- Traffic analysis: Distance vs time graphs can be used to analyze traffic flow and optimize traffic light timing.
- Sports performance analysis: Distance vs time graphs can be used to analyze an athlete’s performance and optimize their training.
- Medical research: Distance vs time graphs can be used to analyze the motion of medical devices and optimize their performance.
Conclusion
Distance vs time graphs are a powerful tool for analyzing the motion of objects. By understanding the basics of these graphs, including their types and how to interpret them, we can gain valuable insights into the world around us. Whether you’re a student, researcher, or professional, mastering distance vs time graphs can help you make more informed decisions and optimize performance.
What is the difference between a distance vs time graph and a velocity vs time graph?
+A distance vs time graph plots the distance traveled by an object against time, while a velocity vs time graph plots the velocity of an object against time.
How do I calculate the speed of an object from a distance vs time graph?
+To calculate the speed of an object from a distance vs time graph, find the slope of the graph by dividing the distance traveled by the time taken.
What are some common mistakes to avoid when working with distance vs time graphs?
+

