Mastering Supply and Demand Analysis Worksheet

Understanding the Fundamentals of Supply and Demand Analysis
In the world of economics, supply and demand analysis is a crucial concept that helps businesses and individuals understand the dynamics of markets and make informed decisions. The supply and demand analysis worksheet is a powerful tool that enables users to visualize and analyze the relationship between the supply and demand curves, making it easier to predict market trends and identify opportunities. In this article, we will explore the fundamentals of supply and demand analysis, the benefits of using a supply and demand analysis worksheet, and provide a step-by-step guide on how to create and use one.
What is Supply and Demand Analysis?
Supply and demand analysis is a method used to understand the behavior of markets by analyzing the relationship between the supply and demand curves. The supply curve represents the quantity of a product or service that producers are willing to sell at a given price level, while the demand curve represents the quantity of a product or service that consumers are willing to buy at a given price level. By analyzing the intersection of these two curves, businesses and individuals can determine the equilibrium price and quantity of a product or service.
Benefits of Using a Supply and Demand Analysis Worksheet
A supply and demand analysis worksheet offers several benefits, including:
- Improved market understanding: By visualizing the supply and demand curves, users can gain a deeper understanding of market trends and dynamics.
- Accurate predictions: By analyzing the intersection of the supply and demand curves, users can make accurate predictions about future market trends and prices.
- Informed decision-making: A supply and demand analysis worksheet enables users to make informed decisions about production, pricing, and investment strategies.
- Time-saving: A worksheet can save users time and effort by providing a quick and easy way to analyze market data.
Creating a Supply and Demand Analysis Worksheet
To create a supply and demand analysis worksheet, follow these steps:
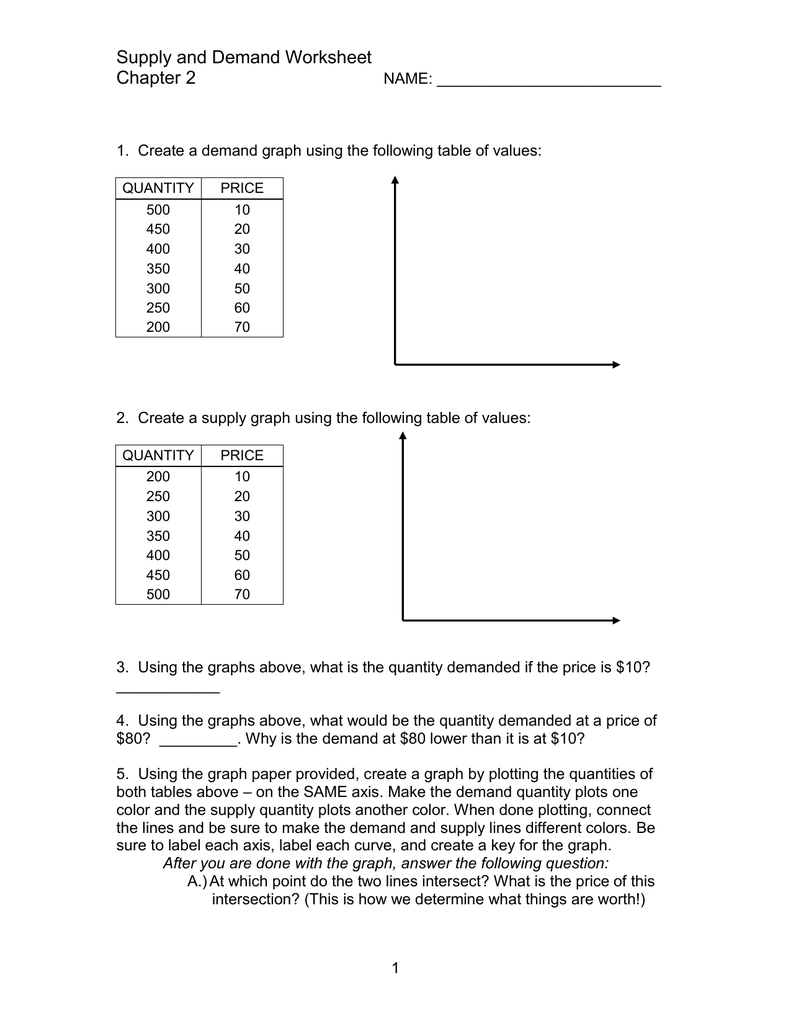
- Gather market data: Collect data on the quantity of a product or service that producers are willing to sell at different price levels (supply data) and the quantity of a product or service that consumers are willing to buy at different price levels (demand data).
- Create a table: Create a table with the following columns:
- Price
- Quantity Supplied
- Quantity Demanded
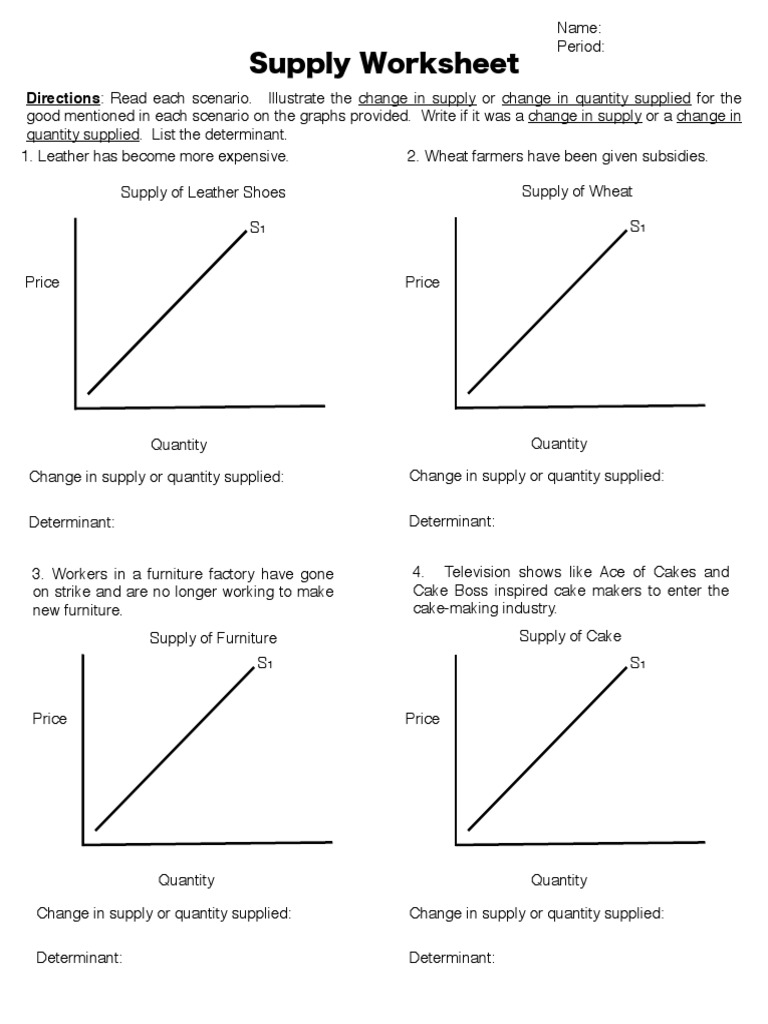
- Plot the supply and demand curves: Using the data, plot the supply and demand curves on a graph. The supply curve should slope upward, while the demand curve should slope downward.
- Identify the equilibrium price and quantity: Identify the point where the supply and demand curves intersect. This is the equilibrium price and quantity.

| Price | Quantity Supplied | Quantity Demanded |
|---|---|---|
| $10 | 100 | 200 |
| $15 | 150 | 150 |
| $20 | 200 | 100 |
Interpreting the Supply and Demand Analysis Worksheet
Once you have created the worksheet, you can use it to analyze market trends and make predictions about future market behavior. Here are a few things to look for:
- Changes in supply and demand: Look for changes in the supply and demand curves. An increase in supply will shift the supply curve to the right, while an increase in demand will shift the demand curve to the right.
- Equilibrium price and quantity: Identify the equilibrium price and quantity. This will give you an idea of the current market conditions.
- Market trends: Analyze the trends in the market. Is the market in equilibrium, or is there a surplus or shortage?
📝 Note: The supply and demand analysis worksheet is a powerful tool, but it is not a substitute for real-world market analysis. Always use real-world data and consider multiple sources when making market predictions.
Common Mistakes to Avoid
When using a supply and demand analysis worksheet, there are several common mistakes to avoid:
- Incorrect data: Make sure to use accurate and reliable data. Incorrect data can lead to incorrect conclusions.
- Incorrect curve plotting: Make sure to plot the supply and demand curves correctly. The supply curve should slope upward, while the demand curve should slope downward.
- Ignoring external factors: Make sure to consider external factors that can affect the market, such as government policies, technological changes, and global events.
Conclusion
In conclusion, a supply and demand analysis worksheet is a powerful tool that can help businesses and individuals understand market trends and make informed decisions. By following the steps outlined in this article, you can create a worksheet that will help you analyze market data and make accurate predictions about future market trends. Remember to avoid common mistakes and always use real-world data.
What is the difference between supply and demand?
+Supply refers to the quantity of a product or service that producers are willing to sell at a given price level, while demand refers to the quantity of a product or service that consumers are willing to buy at a given price level.
How do I create a supply and demand analysis worksheet?
+To create a supply and demand analysis worksheet, gather market data, create a table with the price, quantity supplied, and quantity demanded columns, and plot the supply and demand curves on a graph.
What is the equilibrium price and quantity?
+The equilibrium price and quantity is the point where the supply and demand curves intersect. This is the price and quantity at which the quantity supplied equals the quantity demanded.
Related Terms:
- Changes in supply Worksheet
- Entire supply curve shifts


