Bar Graphs Worksheets for Kids and Adults
Understanding Bar Graphs: A Comprehensive Guide for Kids and Adults
Bar graphs are a fundamental concept in mathematics and data analysis. They are used to represent data in a visual format, making it easier to understand and compare different values. In this article, we will explore the world of bar graphs, including their definition, types, and uses. We will also provide worksheets for kids and adults to practice and reinforce their understanding of bar graphs.
What is a Bar Graph?
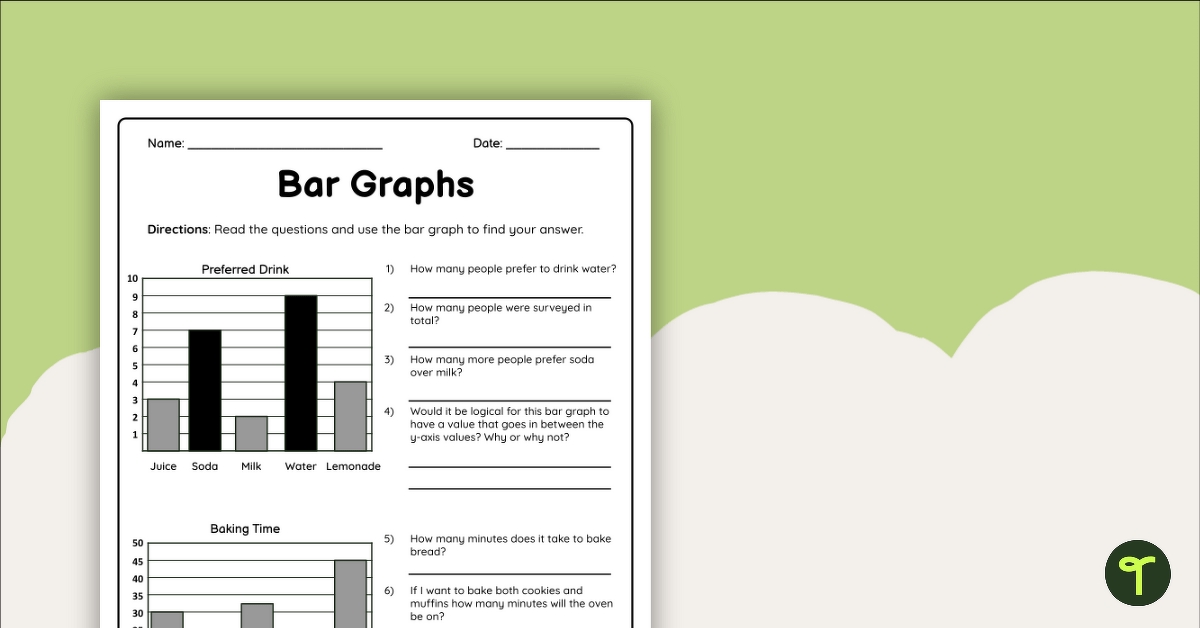
A bar graph is a type of graph that uses bars to represent data. The bars are typically rectangular and are arranged horizontally or vertically. Each bar represents a category or group, and the length of the bar corresponds to the value or quantity of that category. Bar graphs are commonly used to compare data across different categories or groups.
Types of Bar Graphs
There are several types of bar graphs, including:
- Simple Bar Graph: A simple bar graph is the most basic type of bar graph. It consists of a single set of bars, each representing a single category or group.
- Clustered Bar Graph: A clustered bar graph is a type of bar graph that compares multiple categories or groups. Each category or group is represented by a separate bar, and the bars are clustered together to make comparisons easier.
- Stacked Bar Graph: A stacked bar graph is a type of bar graph that shows the contribution of each category or group to a total value. Each bar is divided into segments, each representing a different category or group.
Uses of Bar Graphs
Bar graphs are widely used in various fields, including:
- Business: Bar graphs are used to compare sales data, customer demographics, and market trends.
- Education: Bar graphs are used to display student performance, academic achievement, and educational outcomes.
- Science: Bar graphs are used to display scientific data, such as experimental results and research findings.
- Sports: Bar graphs are used to display team performance, player statistics, and game outcomes.
How to Create a Bar Graph
Creating a bar graph is a straightforward process. Here’s a step-by-step guide:
- Collect data: Collect the data you want to display in your bar graph.
- Choose a scale: Choose a scale for your graph, including the minimum and maximum values.
- Label the axes: Label the x-axis and y-axis of your graph.
- Draw the bars: Draw the bars, each representing a category or group.
- Add titles and labels: Add a title to your graph and labels to each bar.
📝 Note: Make sure to use a consistent scale and labeling system to ensure accuracy and clarity.
Worksheets for Kids
Here are some worksheets for kids to practice creating and interpreting bar graphs:
- Worksheet 1: Create a simple bar graph to display the number of pets in a classroom.
- Worksheet 2: Interpret a bar graph showing the favorite colors of a group of students.
- Worksheet 3: Create a clustered bar graph to compare the scores of two teams in a game.
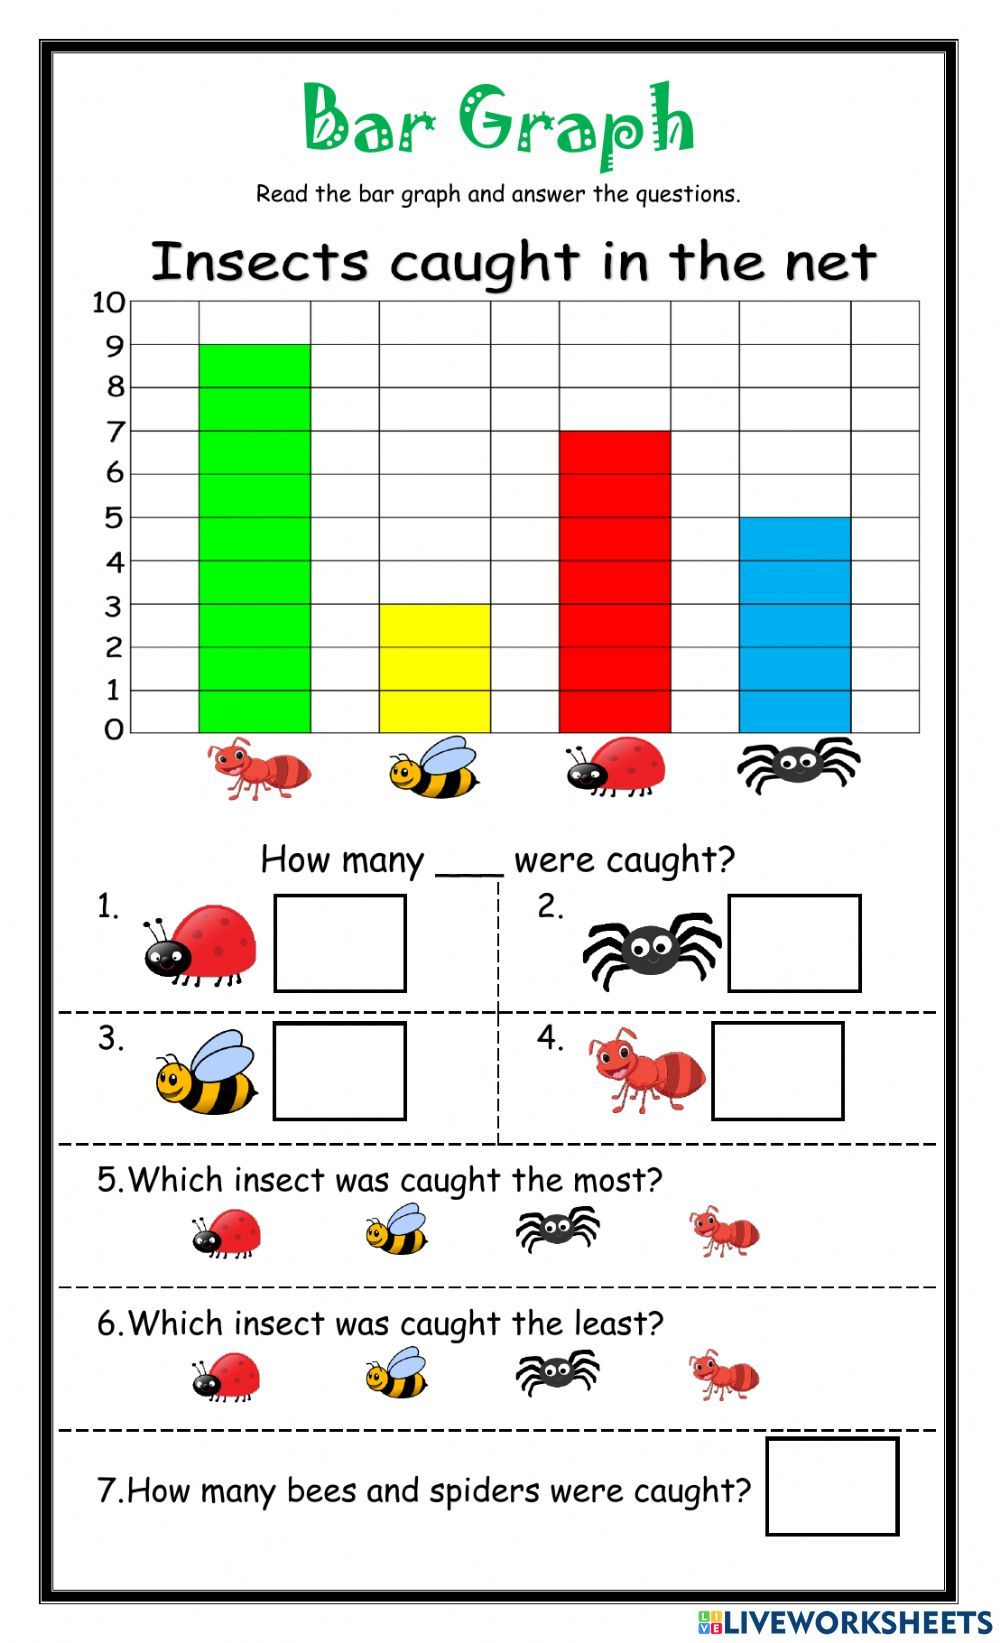
| Worksheet | Description |
|---|---|
| Worksheet 1 | Create a simple bar graph to display the number of pets in a classroom. |
| Worksheet 2 | Interpret a bar graph showing the favorite colors of a group of students. |
| Worksheet 3 | Create a clustered bar graph to compare the scores of two teams in a game. |
Worksheets for Adults
Here are some worksheets for adults to practice creating and interpreting bar graphs:
- Worksheet 1: Create a stacked bar graph to display the sales data of a company.
- Worksheet 2: Interpret a bar graph showing the demographic data of a city.
- Worksheet 3: Create a clustered bar graph to compare the performance of different stocks.
📊 Note: Make sure to use real-world data and scenarios to make the worksheets more relevant and engaging.
As we conclude, bar graphs are a powerful tool for data analysis and visualization. They are widely used in various fields and are an essential skill for kids and adults to learn. With practice and reinforcement, anyone can become proficient in creating and interpreting bar graphs.
What is the purpose of a bar graph?
+The purpose of a bar graph is to display data in a visual format, making it easier to understand and compare different values.
What are the different types of bar graphs?
+There are several types of bar graphs, including simple bar graphs, clustered bar graphs, and stacked bar graphs.
How do I create a bar graph?
+To create a bar graph, collect data, choose a scale, label the axes, draw the bars, and add titles and labels.
Related Terms:
- Line graph
- Bagan
- Diagram lingkaran
- Diagram Venn
- Grafik batang
- Reading bar graphs worksheets
