Position-Time Graph Worksheet
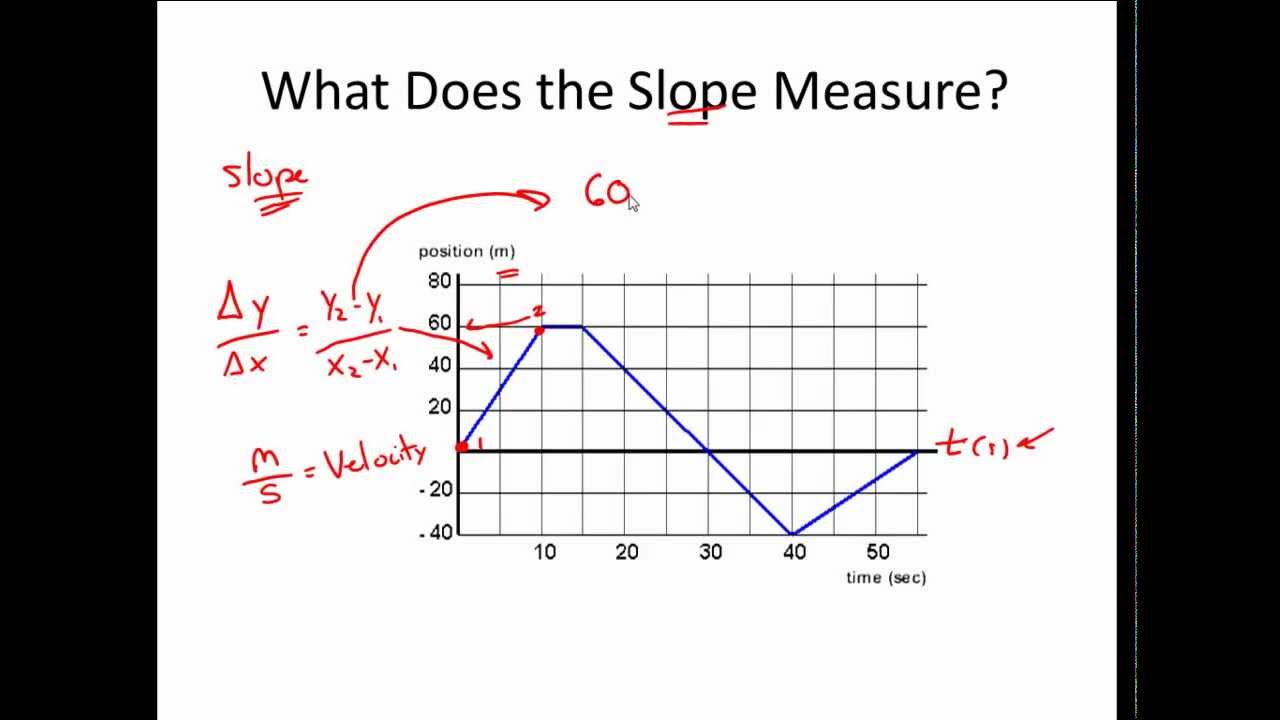
Understanding Position-Time Graphs
A position-time graph is a graphical representation of an object’s position as a function of time. It is a fundamental tool in physics and engineering to analyze and understand the motion of objects. In this worksheet, we will explore the concept of position-time graphs, their interpretation, and how to work with them.
What is a Position-Time Graph?
A position-time graph is a graph that shows the position of an object as a function of time. The graph plots the object’s position on the y-axis and time on the x-axis. The resulting graph can be used to determine the object’s displacement, velocity, and acceleration.
Key Components of a Position-Time Graph
- Position (y-axis): The position of the object is plotted on the y-axis. It can be positive or negative, depending on the direction of the motion.
- Time (x-axis): Time is plotted on the x-axis. It is usually measured in seconds (s).
- Displacement: The displacement of the object is the change in its position over a given time period.
- Velocity: The velocity of the object is the rate of change of its position with respect to time.
- Acceleration: The acceleration of the object is the rate of change of its velocity with respect to time.
Interpreting Position-Time Graphs
Position-time graphs can be interpreted in several ways:
- Constant Velocity: A straight line with a constant slope indicates constant velocity.
- Accelerating Motion: A curved line indicates accelerating motion.
- Decelerating Motion: A curved line with a decreasing slope indicates decelerating motion.
- Constant Position: A horizontal line indicates constant position.
Examples of Position-Time Graphs
Here are a few examples of position-time graphs:
- Example 1: A car travels at a constant velocity of 60 km/h for 2 hours.
- The position-time graph would be a straight line with a slope of 60 km/h.
- Example 2: A ball is thrown upwards with an initial velocity of 20 m/s.
- The position-time graph would be a curved line, with the ball’s position increasing at first and then decreasing as it falls back down.
- Example 3: A train travels from one station to another at a constant acceleration of 2 m/s^2.
- The position-time graph would be a curved line, with the train’s position increasing as it accelerates.
Practice Problems
Here are some practice problems to help you understand position-time graphs:
- A car travels at a constant velocity of 40 km/h for 3 hours. What is the car’s displacement after 3 hours?
- A ball is thrown upwards with an initial velocity of 25 m/s. What is the ball’s maximum height?
- A train travels from one station to another at a constant acceleration of 3 m/s^2. What is the train’s velocity after 5 seconds?
📝 Note: To solve these problems, you need to use the equations of motion and the information given in the problem statement.
Table: Position-Time Graphs Summary
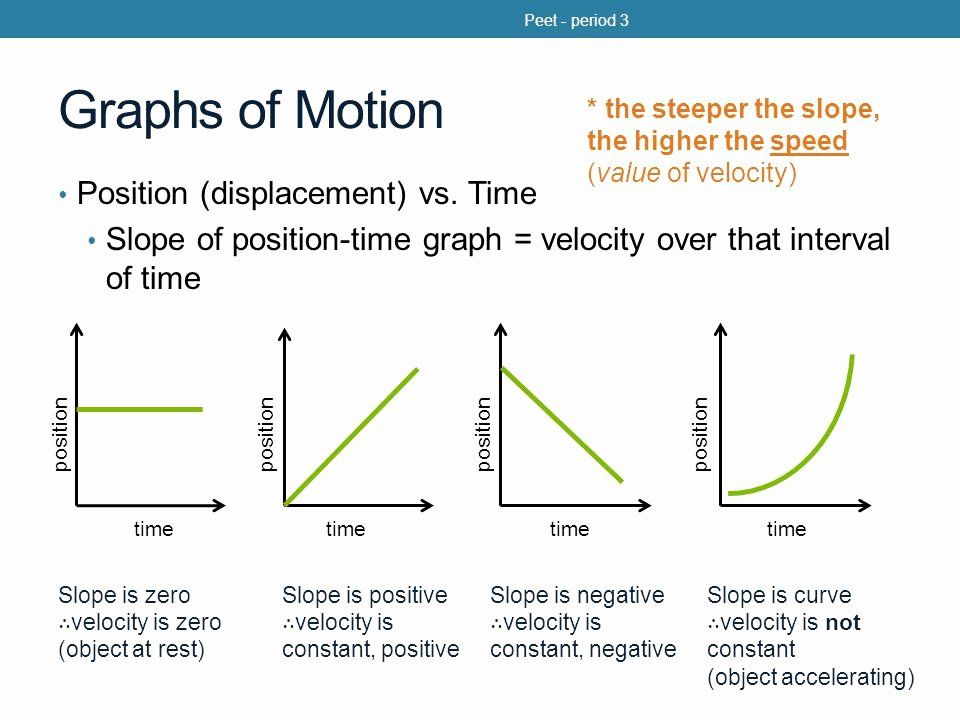
| Type of Motion | Position-Time Graph | Description |
|---|---|---|
| Constant Velocity | Straight line | Velocity is constant |
| Accelerating Motion | Curved line | Velocity is increasing |
| Decelerating Motion | Curved line | Velocity is decreasing |
| Constant Position | Horizontal line | Position is constant |
📝 Note: This table summarizes the main types of position-time graphs and their characteristics.
What is the difference between displacement and distance?
+Displacement is the change in an object's position, while distance is the total length of the path traveled by the object.
How can you determine the velocity of an object from a position-time graph?
+The velocity of an object can be determined by finding the slope of the position-time graph.
What is the significance of the x-intercept in a position-time graph?
+The x-intercept represents the time at which the object's position is zero.
In conclusion, position-time graphs are a powerful tool for analyzing and understanding the motion of objects. By interpreting the shape and slope of the graph, we can determine the object’s displacement, velocity, and acceleration. With practice and experience, you will become proficient in working with position-time graphs and be able to solve a wide range of problems in physics and engineering.
Related Terms:
- position time graph worksheet pdf
- position-time graph questions and answers
- Position vs time graph examples
- Position time graph Worksheet doc
- Position-time graph formula
