Plotting Points Practice Worksheet Exercises for Math Mastery
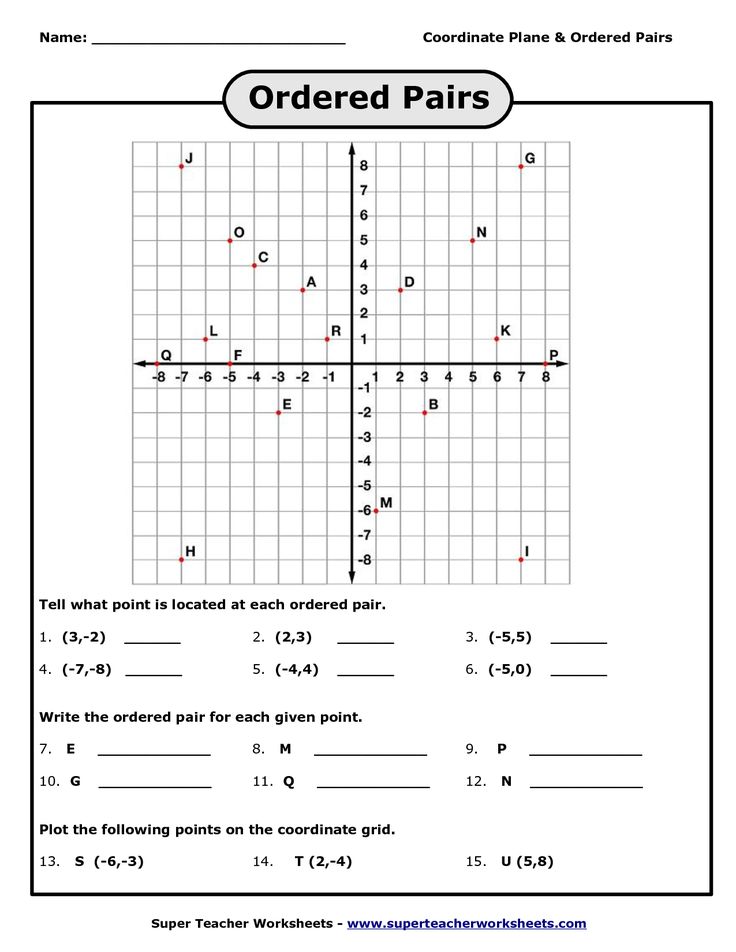
Mastering Plotting Points: A Comprehensive Guide
Plotting points is a fundamental concept in mathematics, particularly in geometry and graphing. It involves identifying and marking specific coordinates on a grid or graph to create shapes, patterns, or visualize relationships between variables. In this article, we will explore the world of plotting points, providing you with practice exercises, tips, and explanations to help you master this essential math skill.
Understanding Coordinate Grids
Before we dive into plotting points, it’s essential to understand the basics of coordinate grids. A coordinate grid is a two-dimensional grid that consists of a horizontal axis (x-axis) and a vertical axis (y-axis). The x-axis typically represents the independent variable, while the y-axis represents the dependent variable.
Key Components of a Coordinate Grid:
- Origin: The point where the x-axis and y-axis intersect, represented as (0, 0).
- Quadrants: The four sections created by the x-axis and y-axis, labeled I, II, III, and IV.
- Axes: The x-axis and y-axis, which divide the grid into four quadrants.
Plotting Points on a Coordinate Grid
Now that we have a solid understanding of coordinate grids, let’s move on to plotting points. To plot a point, you need to identify its coordinates (x, y) and locate it on the grid.
Step-by-Step Guide to Plotting Points:
- Identify the x-coordinate (the horizontal value) and the y-coordinate (the vertical value).
- Locate the x-coordinate on the x-axis and move vertically to the corresponding y-coordinate.
- Mark the point on the grid where the x and y coordinates intersect.
📝 Note: When plotting points, make sure to label each point with its coordinates (x, y).
Practice Exercises: Plotting Points
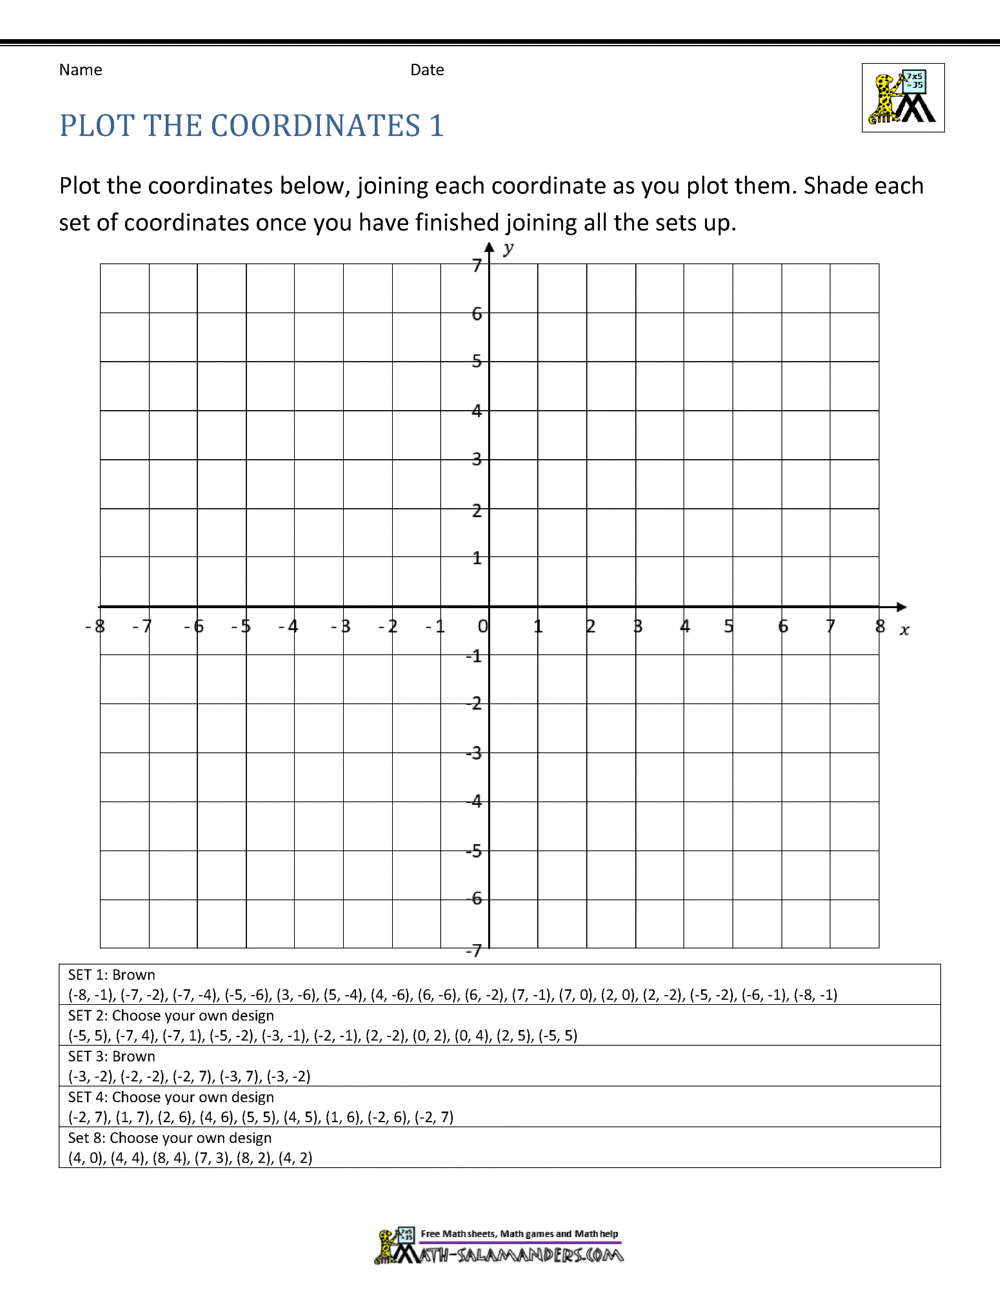
It’s time to put your plotting skills to the test! Try plotting the following points on a coordinate grid:
| Point | Coordinates (x, y) |
|---|---|
| A | (3, 4) |
| B | (-2, 5) |
| C | (0, -3) |
| D | (4, -2) |
| E | (-5, 0) |
Challenge:
Plot the points A, B, C, D, and E on the same coordinate grid. What shape do you notice?
Real-World Applications of Plotting Points
Plotting points is not just a mathematical concept; it has numerous real-world applications:
- GPS Navigation: Plotting points on a map helps navigate and locate specific destinations.
- Graphing: Plotting points on a graph helps visualize relationships between variables.
- Design: Plotting points is essential in graphic design, architecture, and engineering to create precise shapes and patterns.
Tips and Tricks for Mastering Plotting Points
- Use a ruler or straightedge: To ensure accuracy when plotting points.
- Label each point: With its coordinates (x, y) to avoid confusion.
- Use different colors: To differentiate between multiple points and shapes.
- Practice, practice, practice: The more you practice plotting points, the more comfortable you’ll become with the process.
Conclusion
Mastering plotting points is a fundamental skill that requires practice, patience, and attention to detail. By following the steps and tips outlined in this article, you’ll become proficient in plotting points and unlock a world of mathematical possibilities. Remember to apply plotting points to real-world situations and continue practicing to reinforce your skills.
What is the origin of a coordinate grid?
+The origin of a coordinate grid is the point where the x-axis and y-axis intersect, represented as (0, 0).
How do I plot a point on a coordinate grid?
+To plot a point, identify its coordinates (x, y) and locate it on the grid by moving horizontally to the x-coordinate and vertically to the y-coordinate.
What are some real-world applications of plotting points?
+Plotting points has numerous real-world applications, including GPS navigation, graphing, and design.
Related Terms:
- Coordinate worksheet grade 4
- Coordinate plane worksheets
- Coordinate plane grade 6 worksheets
- Worksheet transformations geometry
