7 Ways to Master Plotting Coordinates

Introduction to Plotting Coordinates
Plotting coordinates is a fundamental skill in mathematics, particularly in geometry and trigonometry. It involves identifying points on a coordinate plane using their x and y coordinates. Mastering this skill is crucial for problem-solving in various mathematical concepts, including graphing lines, finding distances, and determining midpoint coordinates. In this article, we will explore seven ways to help you master plotting coordinates.
1. Understanding the Coordinate Plane
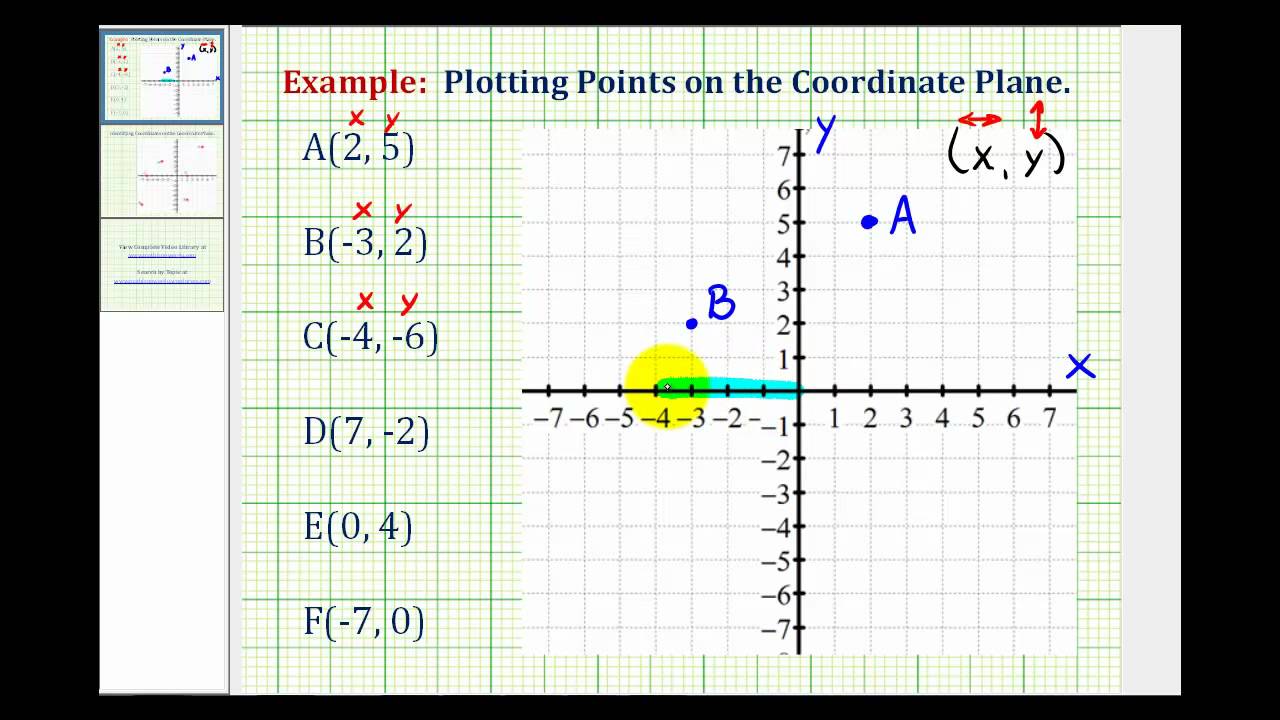
The coordinate plane is a two-dimensional plane with two axes: the x-axis (horizontal) and the y-axis (vertical). The point where the two axes intersect is called the origin, denoted by the coordinates (0, 0). The x-axis is divided into positive and negative values, while the y-axis is also divided into positive and negative values.
📍 Note: The coordinate plane is a two-dimensional representation of points in space, allowing us to visualize and analyze geometric shapes and relationships.
2. Identifying Quadrants
The coordinate plane is divided into four quadrants:
- Quadrant I: (+x, +y)
- Quadrant II: (-x, +y)
- Quadrant III: (-x, -y)
- Quadrant IV: (+x, -y)
Understanding the quadrants helps you identify the location of points on the coordinate plane.
3. Plotting Points
To plot a point on the coordinate plane:
- Start at the origin (0, 0).
- Move horizontally along the x-axis to the desired x-coordinate.
- Move vertically along the y-axis to the desired y-coordinate.
- Mark the point with a dot or a symbol.
For example, to plot the point (3, 4):
- Start at the origin (0, 0).
- Move 3 units to the right along the x-axis.
- Move 4 units up along the y-axis.
- Mark the point with a dot.
4. Using Ordered Pairs
An ordered pair is a pair of numbers written in the form (x, y), where x is the x-coordinate and y is the y-coordinate. When plotting points, always use ordered pairs to ensure accuracy.
For example, the ordered pair (5, 2) represents the point with an x-coordinate of 5 and a y-coordinate of 2.
5. Identifying Special Points
There are several special points on the coordinate plane:
- The origin (0, 0)
- The x-intercept (x, 0)
- The y-intercept (0, y)
- The midpoint ((x1 + x2)/2, (y1 + y2)/2)
Understanding these special points can help you solve problems and visualize geometric relationships.
6. Plotting Lines
To plot a line on the coordinate plane:
- Identify the slope (m) and the y-intercept (b) of the line.
- Use the slope-intercept form of the equation (y = mx + b).
- Plot two points on the line using the equation.
- Draw a line through the two points.
For example, to plot the line y = 2x + 1:
- Identify the slope (m = 2) and the y-intercept (b = 1).
- Use the slope-intercept form of the equation (y = 2x + 1).
- Plot two points on the line: (0, 1) and (1, 3).
- Draw a line through the two points.
7. Practicing with Real-World Applications
Plotting coordinates is not just limited to abstract mathematical concepts. It has numerous real-world applications, such as:
- Navigation: Plotting coordinates on a map to determine distances and directions.
- Architecture: Plotting coordinates to design buildings and structures.
- Computer graphics: Plotting coordinates to create 2D and 3D models.
By practicing with real-world applications, you can develop a deeper understanding of the concept and improve your skills in plotting coordinates.
The ability to master plotting coordinates is essential in mathematics and has numerous real-world applications. By following these seven ways, you can develop a strong foundation in plotting coordinates and improve your problem-solving skills in geometry and trigonometry.
What is the coordinate plane?
+
The coordinate plane is a two-dimensional plane with two axes: the x-axis (horizontal) and the y-axis (vertical). The point where the two axes intersect is called the origin, denoted by the coordinates (0, 0).
How do I plot a point on the coordinate plane?
+
To plot a point on the coordinate plane, start at the origin (0, 0), move horizontally along the x-axis to the desired x-coordinate, move vertically along the y-axis to the desired y-coordinate, and mark the point with a dot or a symbol.
What are the special points on the coordinate plane?
+
The special points on the coordinate plane include the origin (0, 0), the x-intercept (x, 0), the y-intercept (0, y), and the midpoint ((x1 + x2)/2, (y1 + y2)/2).


