Plot The Coordinates Worksheet
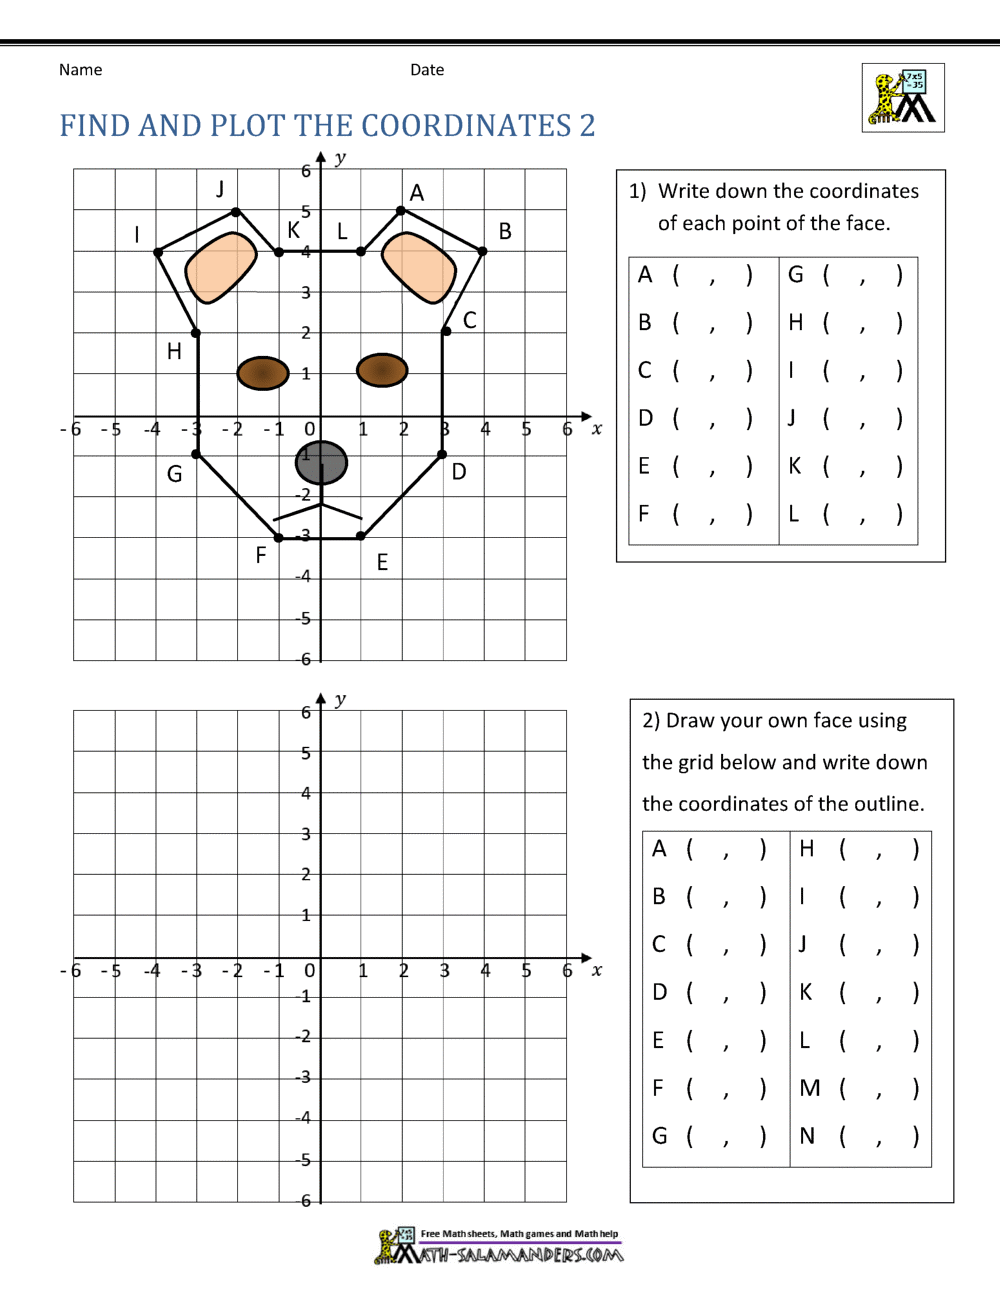
Plotting Coordinates: A Step-by-Step Guide
When working with graphs and coordinates, it’s essential to understand how to plot points accurately. In this worksheet, we’ll explore the basics of plotting coordinates and provide exercises to help you practice.
What are Coordinates?
In mathematics, coordinates are a pair of numbers that describe the location of a point on a grid or graph. The coordinates are usually written in the format (x, y), where:
- x represents the horizontal distance from the origin (0, 0)
- y represents the vertical distance from the origin (0, 0)
How to Plot Coordinates
To plot a coordinate, follow these steps:
- Start at the origin (0, 0)
- Move horizontally to the right (positive x) or left (negative x) by the number of units indicated by the x-coordinate
- Move vertically up (positive y) or down (negative y) by the number of units indicated by the y-coordinate
- Mark the point on the graph
📝 Note: When plotting coordinates, it's essential to pay attention to the signs of the x and y values. A positive x value means moving to the right, while a negative x value means moving to the left. Similarly, a positive y value means moving up, while a negative y value means moving down.
Examples
Let’s practice plotting some coordinates:
- (3, 4): Start at the origin, move 3 units to the right, and then move 4 units up. Mark the point on the graph.
- (-2, -1): Start at the origin, move 2 units to the left, and then move 1 unit down. Mark the point on the graph.
- (0, 5): Start at the origin and move 5 units up. Mark the point on the graph.
Exercises
Plot the following coordinates on a graph:
- (1, 2)
- (-3, 4)
- (0, -2)
- (2, -1)
- (-1, 3)
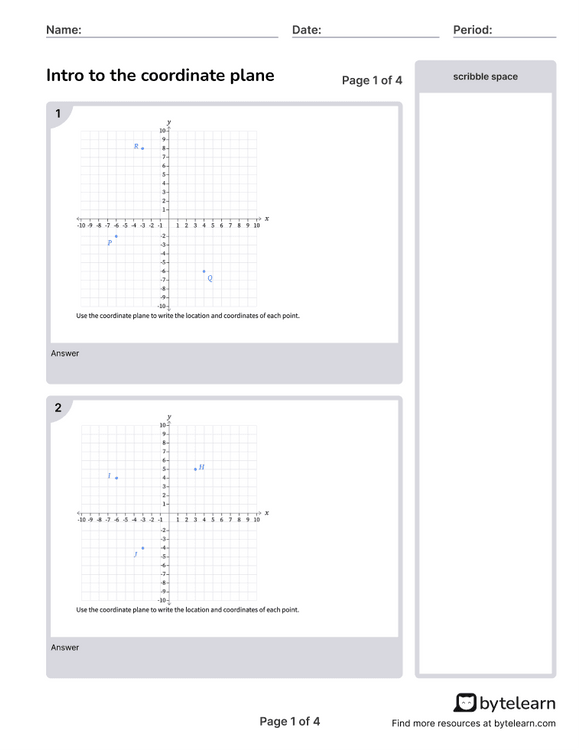
| Coordinate | x-coordinate | y-coordinate |
|---|---|---|
| (1, 2) | 1 | 2 |
| (-3, 4) | -3 | 4 |
| (0, -2) | 0 | -2 |
| (2, -1) | 2 | -1 |
| (-1, 3) | -1 | 3 |
📝 Note: Make sure to label the x and y axes on your graph and use a ruler to draw the lines accurately.
In conclusion, plotting coordinates is a fundamental skill in mathematics, and with practice, you’ll become more confident and proficient. Remember to pay attention to the signs of the x and y values, and use a ruler to draw the lines accurately.
What is the origin in a coordinate plane?
+The origin is the point where the x and y axes intersect, represented by the coordinates (0, 0).
How do I determine the quadrant of a coordinate?
+To determine the quadrant of a coordinate, look at the signs of the x and y values. If both values are positive, the point is in Quadrant I. If the x value is negative and the y value is positive, the point is in Quadrant II, and so on.
Can I plot coordinates with decimal values?
+Yes, you can plot coordinates with decimal values. Simply move horizontally or vertically by the decimal value, and mark the point on the graph.
