Piecewise Function Worksheet with Answers

Understanding Piecewise Functions
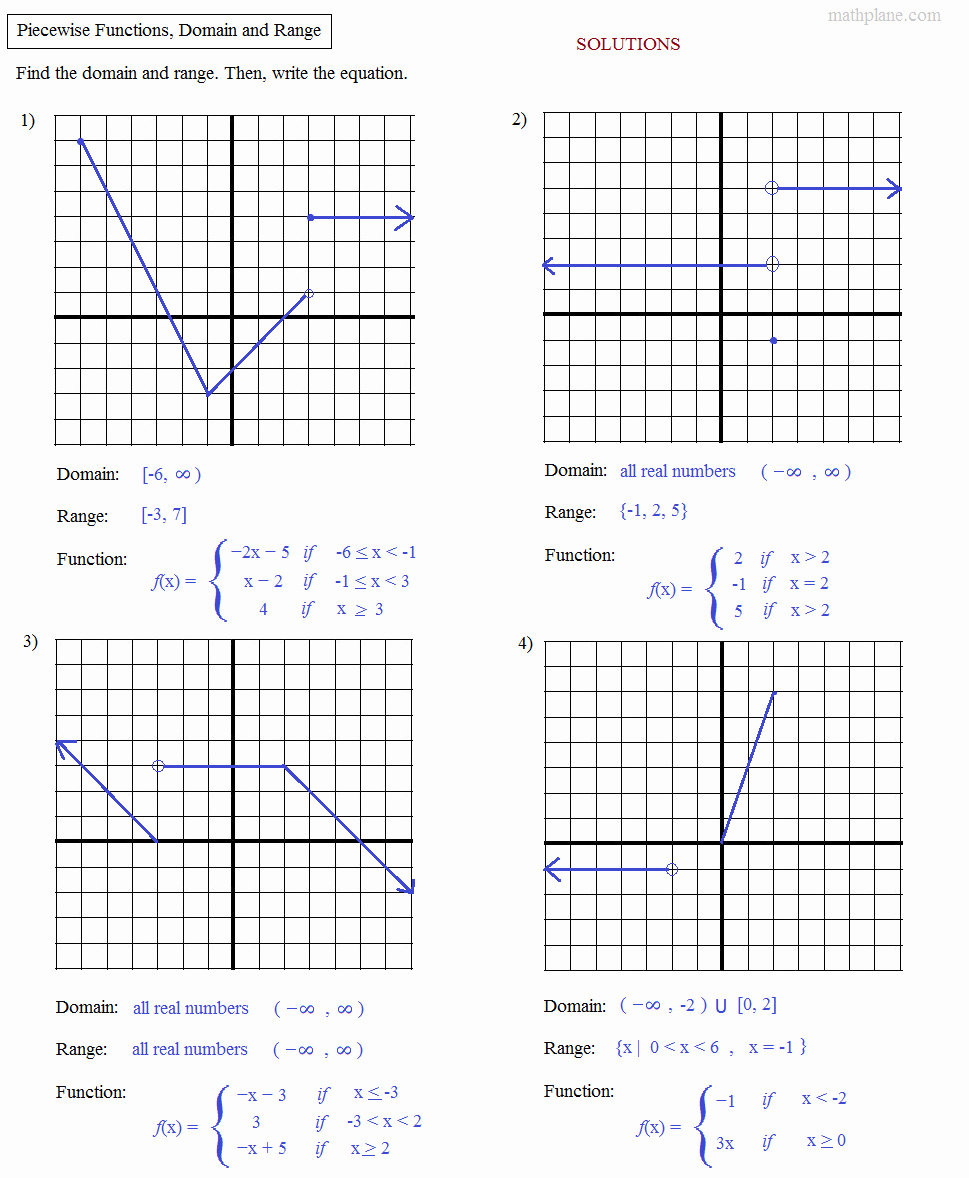
Piecewise functions are a type of mathematical function that is defined by multiple sub-functions, each applied to a specific interval of the domain. These functions are used to model real-world situations where the behavior of the system changes depending on the input value.
What is a Piecewise Function?
A piecewise function is a function that is defined by multiple sub-functions, each applied to a specific interval of the domain. The general form of a piecewise function is:
f(x) = { g(x) if x is in the interval [a, b) h(x) if x is in the interval [b, c) … }
where g(x), h(x),… are sub-functions that define the behavior of the function on each interval.
Example of a Piecewise Function
Consider the following piecewise function:
f(x) = { x^2 if x < 0 x + 1 if 0 ≤ x < 2 3x - 2 if x ≥ 2 }
This function is defined by three sub-functions:
- x^2 for x < 0
- x + 1 for 0 ≤ x < 2
- 3x - 2 for x ≥ 2
Evaluating Piecewise Functions
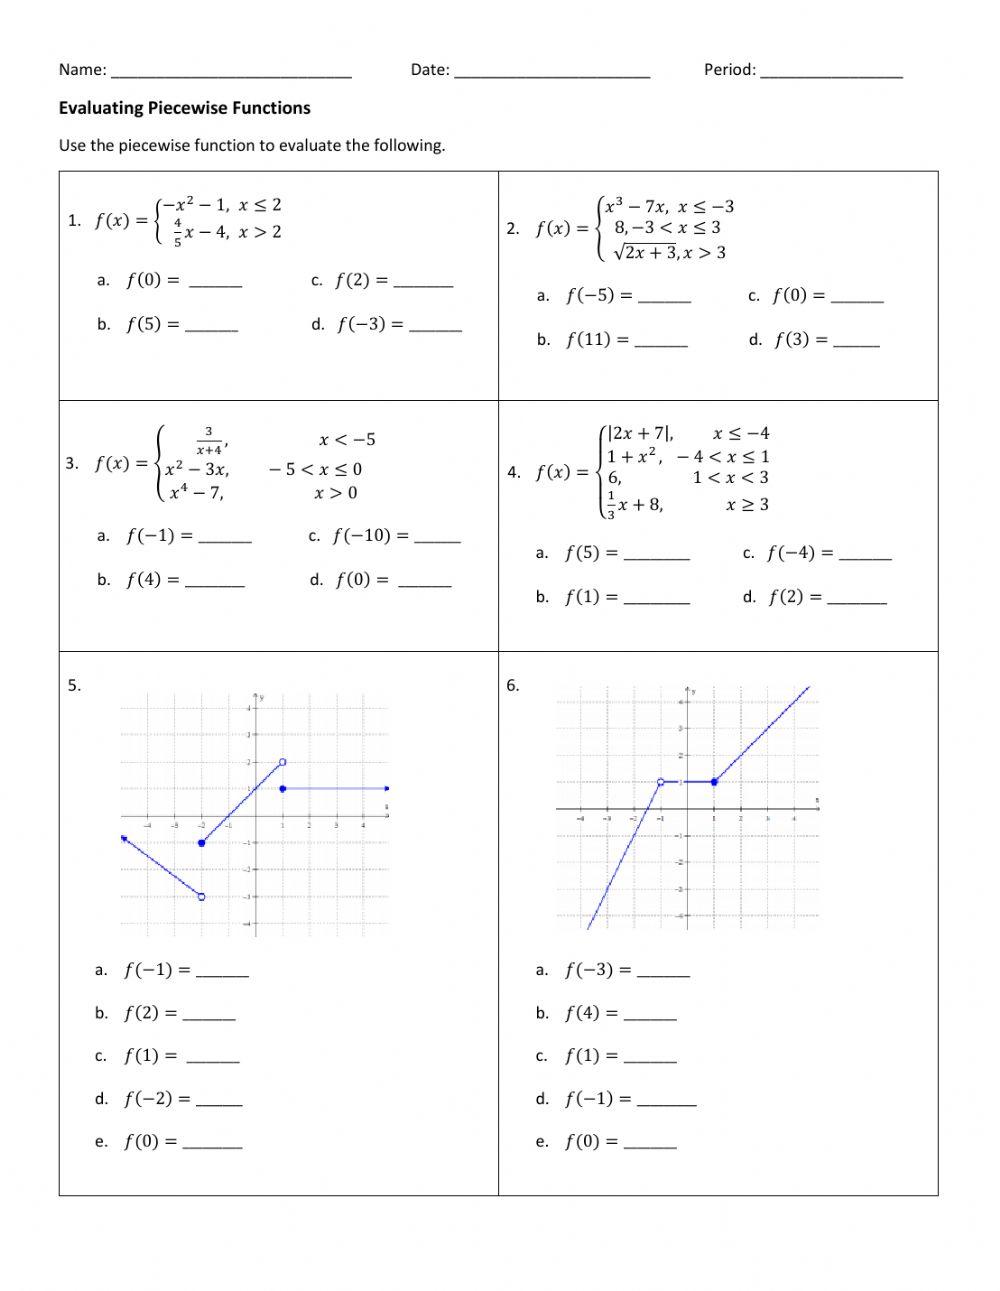
To evaluate a piecewise function, we need to determine which sub-function to apply based on the input value. For example, to evaluate f(1), we would apply the sub-function x + 1, since 1 is in the interval [0, 2).
- Identify the interval that the input value belongs to.
- Apply the corresponding sub-function to the input value.
📝 Note: Make sure to identify the correct interval and apply the correct sub-function when evaluating a piecewise function.
Graphing Piecewise Functions
To graph a piecewise function, we need to graph each sub-function on its corresponding interval. The resulting graph will be a combination of the graphs of the individual sub-functions.
Consider the piecewise function:
f(x) = { x^2 if x < 0 x + 1 if 0 ≤ x < 2 3x - 2 if x ≥ 2 }
To graph this function, we would graph the following:
- x^2 for x < 0
- x + 1 for 0 ≤ x < 2
- 3x - 2 for x ≥ 2
The resulting graph would be a combination of the graphs of these three sub-functions.
Piecewise Function Worksheet
Now it’s your turn to practice! Try to evaluate and graph the following piecewise functions:
- f(x) = { x + 2 if x < -1 2x - 1 if -1 ≤ x < 1 x^2 - 1 if x ≥ 1 }
a. Evaluate f(-2)
b. Evaluate f(0)
c. Evaluate f(2)
d. Graph the function f(x)
- f(x) = { 2x + 1 if x < 0 x - 2 if 0 ≤ x < 3 x^2 + 1 if x ≥ 3 }
a. Evaluate f(-1)
b. Evaluate f(2)
c. Evaluate f(4)
d. Graph the function f(x)
- f(x) = { x^2 - 1 if x < 1 2x - 2 if 1 ≤ x < 3 x + 1 if x ≥ 3 }
a. Evaluate f(0)
b. Evaluate f(2)
c. Evaluate f(4)
d. Graph the function f(x)
Answers
- f(x) = { x + 2 if x < -1 2x - 1 if -1 ≤ x < 1 x^2 - 1 if x ≥ 1 }
a. f(-2) = (-2) + 2 = 0
b. f(0) = 2(0) - 1 = -1
c. f(2) = (2)^2 - 1 = 3
d. Graph:
|x| |f(x)|

| -2 | 0 |
| -1 | 1 |
| 0 | -1 |
| 1 | -1 |
| 2 | 3 |
- f(x) = { 2x + 1 if x < 0 x - 2 if 0 ≤ x < 3 x^2 + 1 if x ≥ 3 }
a. f(-1) = 2(-1) + 1 = -1
b. f(2) = 2 - 2 = 0
c. f(4) = (4)^2 + 1 = 17
d. Graph:
|x| |f(x)|
| -1 | -1 |
| 0 | -2 |
| 2 | 0 |
| 3 | 10 |
| 4 | 17 |
- f(x) = { x^2 - 1 if x < 1 2x - 2 if 1 ≤ x < 3 x + 1 if x ≥ 3 }
a. f(0) = (0)^2 - 1 = -1
b. f(2) = 2(2) - 2 = 2
c. f(4) = 4 + 1 = 5
d. Graph:
|x| |f(x)|
| 0 | -1 |
| 1 | -1 |
| 2 | 2 |
| 3 | 4 |
| 4 | 5 |
What is a piecewise function?
+A piecewise function is a function that is defined by multiple sub-functions, each applied to a specific interval of the domain.
How do I evaluate a piecewise function?
+To evaluate a piecewise function, identify the interval that the input value belongs to and apply the corresponding sub-function to the input value.
How do I graph a piecewise function?
+To graph a piecewise function, graph each sub-function on its corresponding interval. The resulting graph will be a combination of the graphs of the individual sub-functions.


