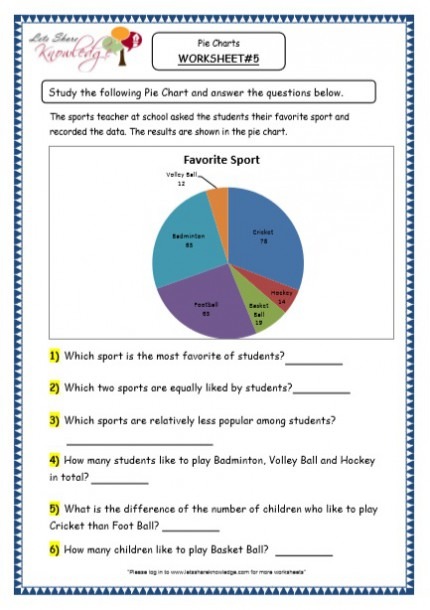
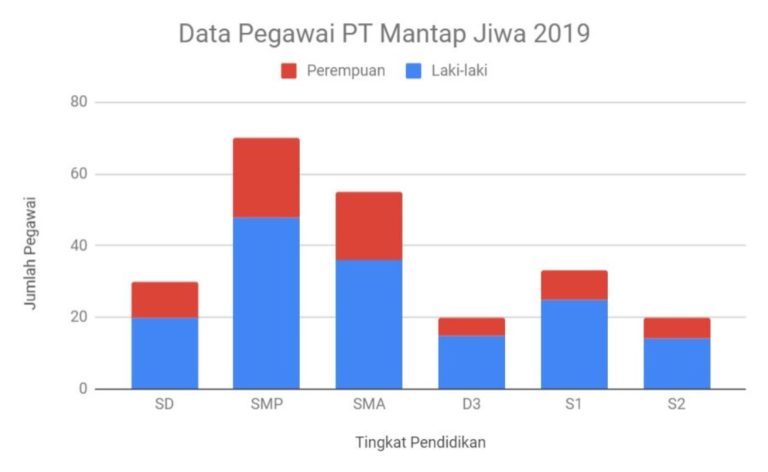
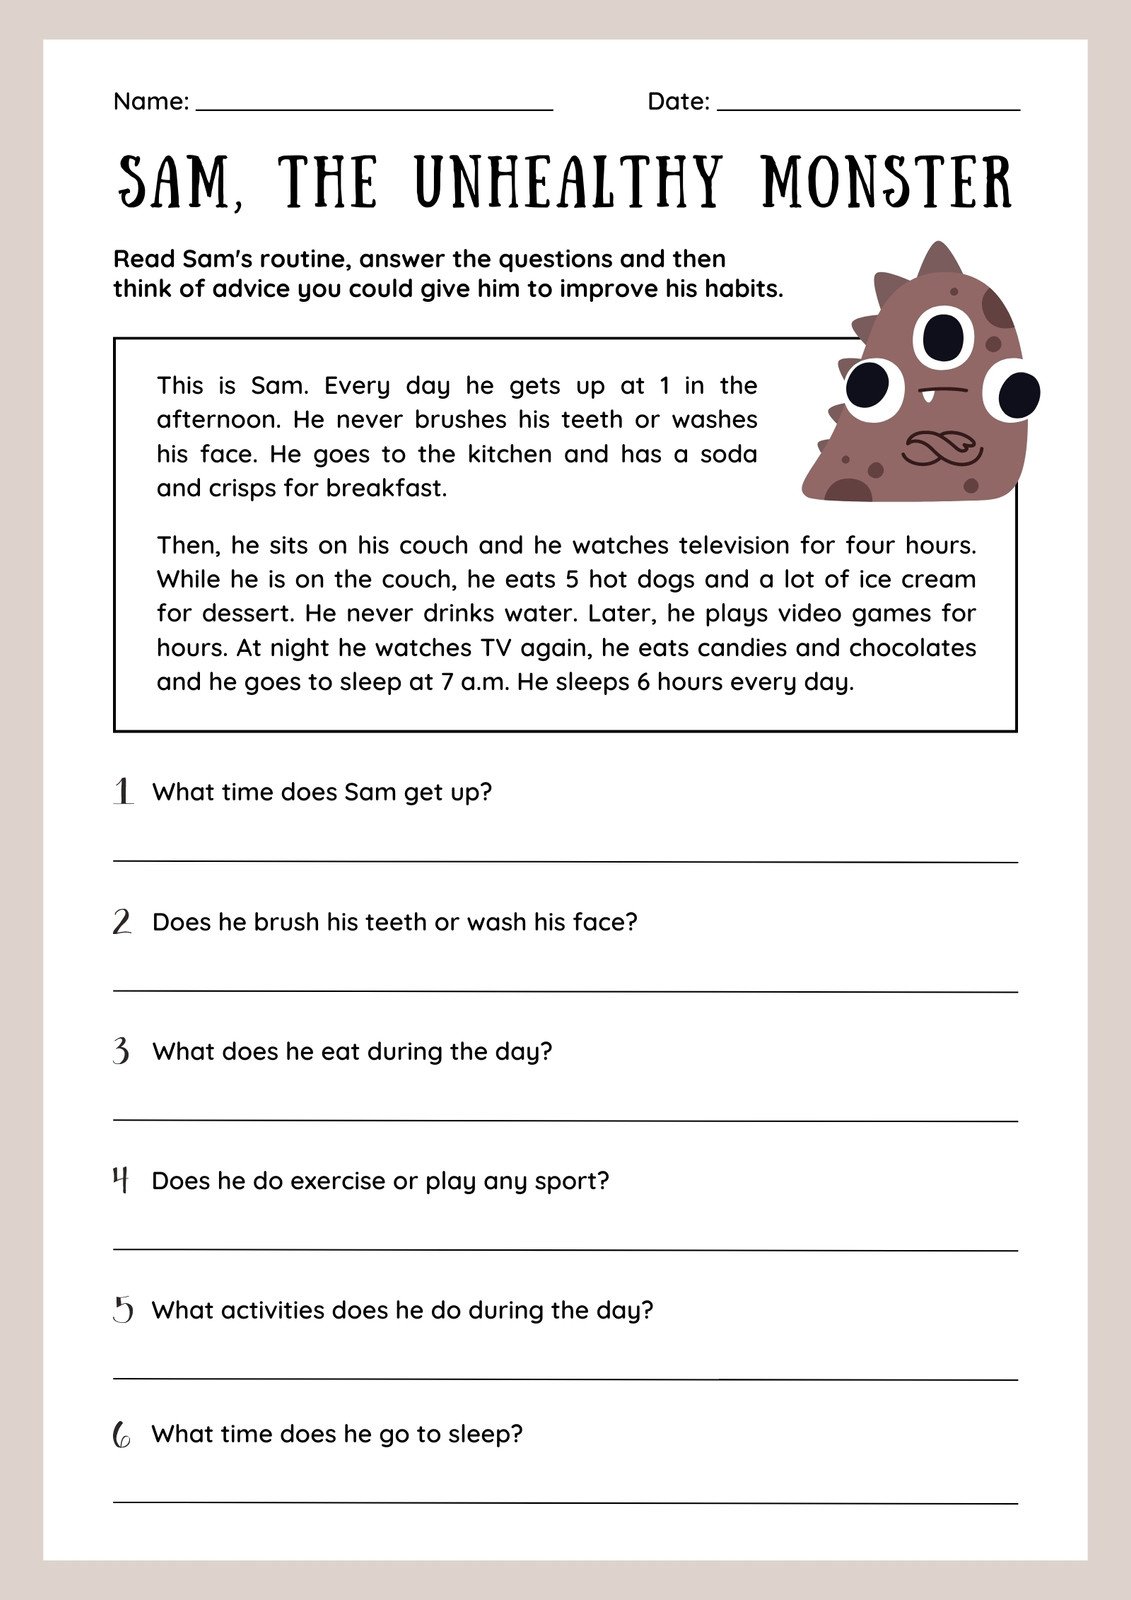
Pie Chart Worksheets for Kids

Understanding Pie Charts: A Comprehensive Guide for Kids
Pie charts are a fun and easy way to visualize data and understand how different parts contribute to a whole. As a parent or educator, you want to help your kids develop essential math skills, including data analysis and interpretation. In this article, we’ll explore the world of pie charts, provide worksheets for kids, and offer tips for teaching this concept.
What is a Pie Chart?
A pie chart is a circular graph divided into sectors, each representing a proportion of the whole. The circle is like a pizza, and each sector is like a slice. The size of each slice shows how much of the total it represents.
Why Use Pie Charts?
Pie charts are an excellent way to:
- Show how different parts contribute to a whole
- Compare proportions of different groups
- Visualize data in a simple and intuitive way
How to Read a Pie Chart
To read a pie chart, follow these steps:
- Look at the title: Understand what the chart is about.
- Identify the sectors: See the different slices of the pie.
- Check the legend: Understand what each color or symbol represents.
- Compare the sizes: See how big each sector is compared to the others.
Pie Chart Worksheets for Kids
Here are some fun and interactive worksheets to help your kids learn about pie charts:
Worksheet 1: Simple Pie Chart
Create a pie chart to show the favorite colors of a class of 20 students.

| Color | Number of Students |
|---|---|
| Red | 5 |
| Blue | 7 |
| Green | 4 |
| Yellow | 4 |
Worksheet 2: Analyzing a Pie Chart
Look at the pie chart below and answer the questions:

- What is the most popular flavor of ice cream?
- How many students prefer chocolate ice cream?
- What percentage of students like strawberry ice cream?
Worksheet 3: Creating a Pie Chart
Create a pie chart to show the different types of pets owned by 15 families.
| Pet Type | Number of Families |
|---|---|
| Dogs | 6 |
| Cats | 4 |
| Fish | 3 |
| Birds | 2 |
Tips for Teaching Pie Charts
- Use real-life examples: Use everyday situations, such as favorite foods or sports, to make the concept more relatable.
- Make it interactive: Use worksheets, quizzes, and games to keep your kids engaged.
- Practice, practice, practice: Provide plenty of opportunities for your kids to practice reading and creating pie charts.
📝 Note: You can adjust the difficulty level of the worksheets according to your child's grade level and math skills.
Common Mistakes to Avoid
- Misinterpreting the data: Make sure your kids understand what the data represents and how to interpret it correctly.
- Not labeling the sectors: Ensure your kids label each sector correctly to avoid confusion.
- Not checking the legend: Remind your kids to check the legend to understand what each color or symbol represents.
What is the main purpose of a pie chart?
+The main purpose of a pie chart is to show how different parts contribute to a whole.
How do I read a pie chart?
+To read a pie chart, look at the title, identify the sectors, check the legend, and compare the sizes of each sector.
What are some common mistakes to avoid when working with pie charts?
+Common mistakes to avoid include misinterpreting the data, not labeling the sectors, and not checking the legend.
By following these tips and using the worksheets provided, your kids will become pie chart experts in no time! Remember to practice regularly and make learning fun and interactive.
Related Terms:
- Grafik batang
- Bagan
- Matematika
- Graf
- Diagram lingkaran
- Pie chart worksheets grade 8


