Phase Diagram Worksheet Answer Key Simplified

Understanding phase diagrams is a crucial aspect of chemistry and physics, providing a visual representation of the states of matter under different conditions of temperature and pressure. Below is a simplified guide to working with phase diagrams, along with answers to common questions in a worksheet format.
Understanding Phase Diagrams
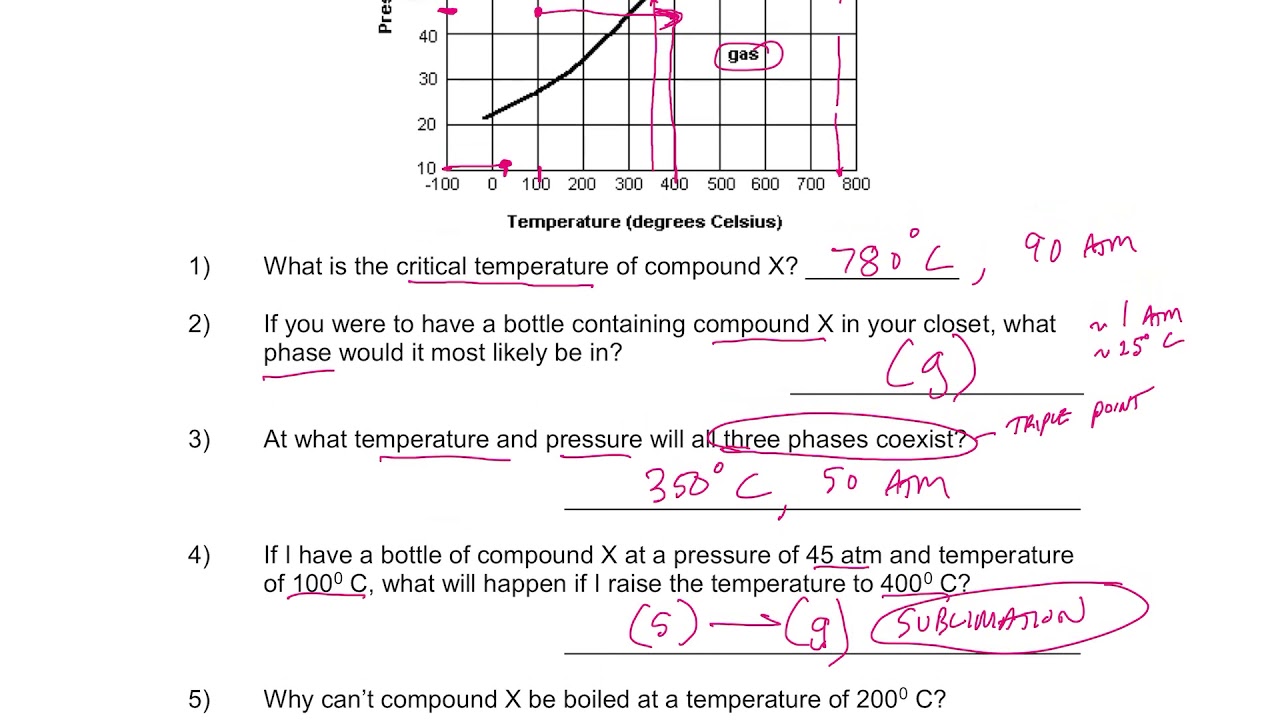
Phase diagrams are graphical representations of the physical states of a substance under different conditions of temperature and pressure. These diagrams are essential for understanding the behavior of pure substances and mixtures. The basic components of a phase diagram include:
- Lines: Represent the boundaries between different phases. For instance, the line between the solid and liquid phases is the melting curve, and the line between the liquid and gas phases is the vaporization curve.
- Regions: The areas within the phase diagram represent the conditions of temperature and pressure where a substance exists in a specific phase (solid, liquid, or gas).
- Triple Point: The point where all three phases (solid, liquid, and gas) coexist in equilibrium. This is a unique set of temperature and pressure conditions.
Worksheet Questions and Answers
Question 1: What does the triple point in a phase diagram represent?
- Answer: The triple point represents the specific temperature and pressure at which a substance can exist in all three phases: solid, liquid, and gas, simultaneously.
Question 2: Identify the line that separates the solid and liquid phases in a phase diagram.
- Answer: The line that separates the solid and liquid phases is known as the melting curve.
Question 3: What is the significance of the critical point in a phase diagram?
- Answer: The critical point is the temperature and pressure above which the distinction between the liquid and gas phases disappears. Above this point, the substance is considered a supercritical fluid.
Question 4: Describe the region in a phase diagram where a substance is in its liquid phase.
- Answer: The region below the vaporization curve and above the melting curve represents the conditions under which a substance exists in its liquid phase.
Question 5: Can a substance exist in more than one phase at the same time under certain conditions?
- Answer: Yes, at the triple point, a substance can exist in solid, liquid, and gas phases simultaneously.
Question 6: What happens to a substance when it crosses the vaporization curve from the liquid to the gas phase?
- Answer: When a substance crosses the vaporization curve from the liquid to the gas phase, it undergoes vaporization or boiling.
Question 7: Why are phase diagrams useful in chemistry and physics?
- Answer: Phase diagrams are useful for understanding the behavior of substances under various conditions, predicting phase changes, and determining the properties of substances in different phases.
Question 8: What does the slope of the melting curve in a phase diagram indicate?
- Answer: The slope of the melting curve indicates how the melting point of a substance changes with pressure.
📝 Note: Understanding phase diagrams is essential for predicting the behavior of substances under different conditions, making them a fundamental tool in chemistry and physics.
What is the purpose of a phase diagram?
+A phase diagram is used to visualize the states of matter of a substance under different conditions of temperature and pressure.
What is unique about the triple point in a phase diagram?
+The triple point is unique because it is the only set of conditions where all three phases (solid, liquid, and gas) can coexist in equilibrium.
What happens to a substance above the critical point in a phase diagram?
+Above the critical point, the substance becomes a supercritical fluid, where the distinction between the liquid and gas phases disappears.
In summary, phase diagrams are crucial tools for understanding the behavior of substances under various conditions of temperature and pressure. By analyzing a phase diagram, one can predict phase changes, determine the properties of substances in different phases, and understand the unique conditions represented by the triple point and the critical point.


