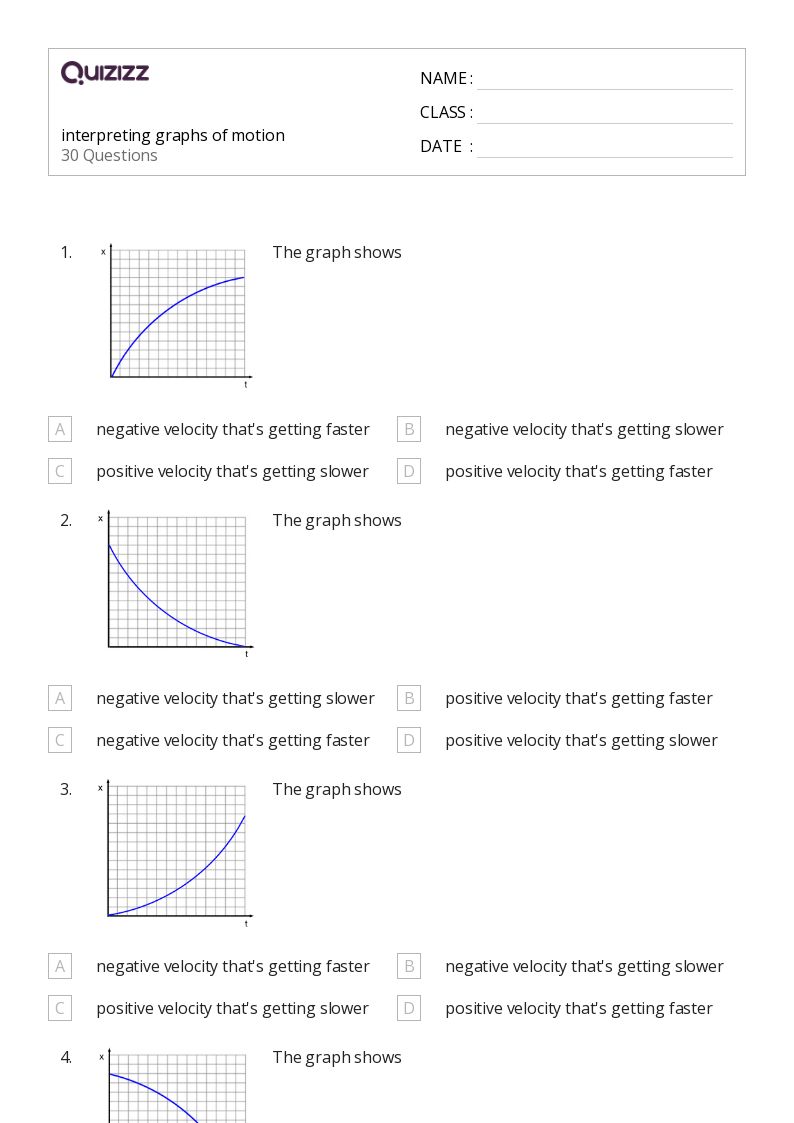
5 Ways to Master Interpreting a Graph Worksheet

Unlocking the Secrets of Graph Interpretation
Graph interpretation is a fundamental skill in various fields, including mathematics, science, and economics. It allows us to extract valuable insights from complex data and make informed decisions. However, interpreting a graph can be a daunting task, especially for those who are new to it. In this article, we will explore five ways to master interpreting a graph worksheet, making it easier for you to extract meaningful information from graphs.
Understand the Basics of Graphs
Before diving into the world of graph interpretation, it’s essential to understand the basic components of a graph. A typical graph consists of:
- X-axis: The horizontal axis that represents the independent variable.
- Y-axis: The vertical axis that represents the dependent variable.
- Title: A brief description of the graph.
- Legend: A key that explains the symbols, colors, or patterns used in the graph.
- Scale: The range of values represented on the x and y axes.
Familiarize yourself with these components to build a solid foundation for graph interpretation.
Identify the Type of Graph
There are several types of graphs, each with its unique characteristics and uses. Some common types of graphs include:
- Line Graph: Used to show trends or patterns over time.
- Bar Graph: Used to compare categorical data.
- Pie Chart: Used to show proportions or percentages.
- Scatter Plot: Used to show the relationship between two variables.
Identifying the type of graph will help you understand the context and purpose of the data being presented.
Analyze the Axes and Scale
The x and y axes provide crucial information about the data being presented. Pay attention to:
- Axis labels: Ensure you understand what each axis represents.
- Scale: Check the range of values represented on each axis.
- Intervals: Note the intervals between tick marks to understand the granularity of the data.
A well-labeled and scaled graph can help you extract meaningful insights from the data.
Look for Patterns and Trends
Graphs often reveal patterns and trends that can be used to make predictions or informed decisions. Look for:
- Increasing or decreasing trends: Identify whether the data is increasing or decreasing over time.
- Seasonal patterns: Check for periodic fluctuations in the data.
- Correlations: Look for relationships between variables.
By identifying patterns and trends, you can gain a deeper understanding of the data and make more informed decisions.
Use Graph Interpretation Strategies
To take your graph interpretation skills to the next level, use the following strategies:
- Zoom in and out: Focus on specific sections of the graph to gain a deeper understanding of the data.
- Compare and contrast: Compare different graphs or sections of the same graph to identify similarities and differences.
- Ask questions: Ask questions about the data, such as “What is the purpose of the graph?” or “What insights can be gained from the data?”
By using these strategies, you can extract meaningful insights from graphs and make more informed decisions.
📝 Note: Practice is key to mastering graph interpretation. The more you practice, the more comfortable you'll become with extracting insights from graphs.
In conclusion, mastering graph interpretation requires a combination of understanding the basics of graphs, identifying the type of graph, analyzing the axes and scale, looking for patterns and trends, and using graph interpretation strategies. By following these five ways, you’ll be well on your way to becoming a graph interpretation expert.
What is the most important thing to consider when interpreting a graph?
+
Understanding the basics of the graph, including the x and y axes, title, legend, and scale, is the most important thing to consider when interpreting a graph.
How do I identify patterns and trends in a graph?
+
Look for increasing or decreasing trends, seasonal patterns, and correlations between variables to identify patterns and trends in a graph.
What is the purpose of a graph legend?
+
A graph legend explains the symbols, colors, or patterns used in the graph, making it easier to understand the data being presented.
Related Terms:
- Interpreting graphs PDF
- Interpreting graphs Worksheet PDF
- Interpreting line graphs Worksheet


