Exploring the H-R Diagram Worksheet for Astronomy Students

Understanding the H-R Diagram: A Fundamental Tool in Astronomy
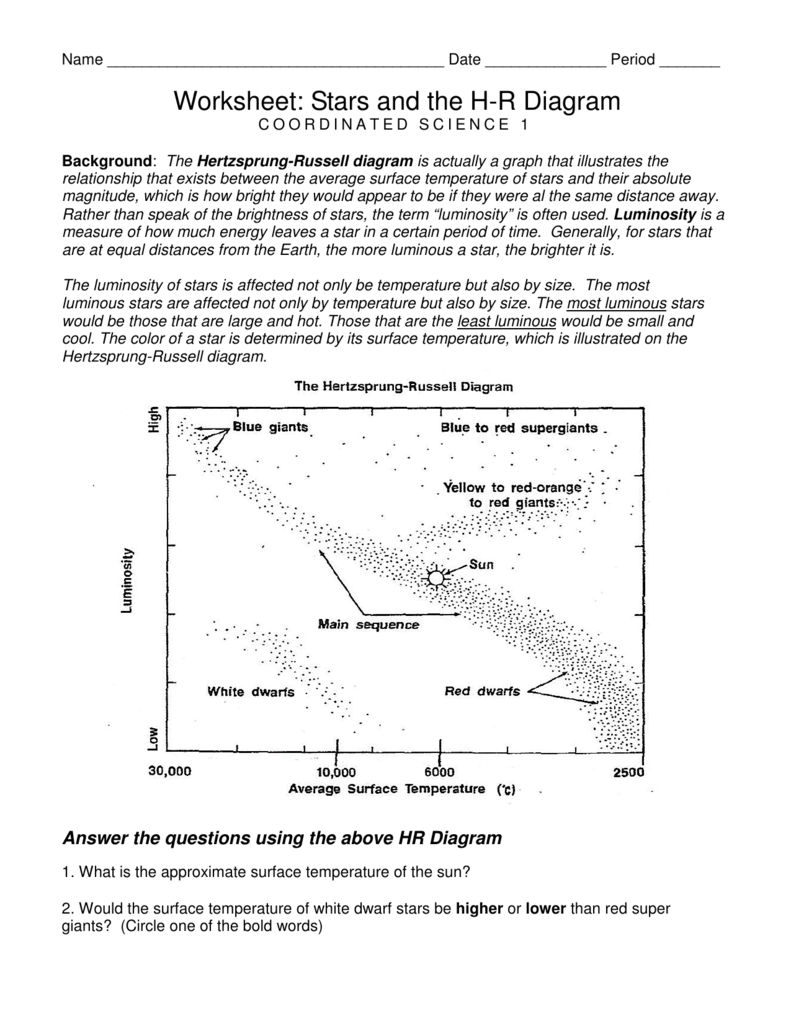
The Hertzsprung-Russell (H-R) diagram is a fundamental tool in astronomy that has revolutionized our understanding of stars and their evolution. Introduced by Ejnar Hertzsprung and Henry Norris Russell in the early 20th century, the H-R diagram is a graphical representation of the relationship between a star’s luminosity (or brightness) and its surface temperature. In this article, we will explore the H-R diagram worksheet, its significance, and how it helps astronomy students understand the properties of stars.
The Components of the H-R Diagram
The H-R diagram consists of two main axes: the horizontal axis represents the surface temperature of a star, while the vertical axis represents its luminosity. The surface temperature is typically measured in Kelvin (K), with hotter stars appearing on the left side of the diagram and cooler stars on the right. The luminosity is measured in units of solar luminosity (L), with more luminous stars appearing higher on the diagram.
Key Features of the H-R Diagram:
- Main Sequence: The main sequence is a diagonal line that runs from the top left to the bottom right of the diagram. It represents the stage at which stars are fusing hydrogen into helium in their cores. Most stars spend the majority of their lives on the main sequence.
- Red Giant Branch: The red giant branch is a curved line that extends from the main sequence to the upper right of the diagram. It represents the stage at which stars have exhausted their hydrogen fuel and have expanded to become red giants.
- White Dwarf Cooling Track: The white dwarf cooling track is a diagonal line that runs from the upper left to the lower right of the diagram. It represents the stage at which stars have exhausted their fuel and have shed their outer layers, leaving behind a hot, compact core.
Interpreting the H-R Diagram
The H-R diagram is a powerful tool for understanding the properties of stars. By plotting a star’s luminosity and surface temperature on the diagram, astronomers can determine its:
- Mass: Stars with higher masses appear above the main sequence, while those with lower masses appear below.
- Age: Stars that are older and more evolved appear on the red giant branch or white dwarf cooling track.
- Evolutionary Stage: The H-R diagram shows the different stages of a star’s life, from the main sequence to the red giant branch and finally to the white dwarf cooling track.
Examples of H-R Diagram Analysis:
- Identifying Star Clusters: By plotting the stars in a cluster on the H-R diagram, astronomers can determine the age and metallicity of the cluster.
- Determining Stellar Distances: By comparing the luminosity of a star to its apparent brightness, astronomers can determine its distance from Earth.
Practical Applications of the H-R Diagram
The H-R diagram has numerous practical applications in astronomy, including:
- Stellar Evolution: The H-R diagram helps astronomers understand the life cycle of stars and how they evolve over time.
- Galaxy Evolution: The H-R diagram provides insights into the formation and evolution of galaxies, including the distribution of stars and gas.
- Exoplanet Detection: The H-R diagram can be used to identify potential exoplanet host stars and determine their properties.
🔍 Note: The H-R diagram is a complex tool that requires a deep understanding of stellar physics and astronomy. Students should be encouraged to explore the diagram in more detail and practice analyzing its different features.
Conclusion
The H-R diagram is a fundamental tool in astronomy that provides a wealth of information about stars and their evolution. By understanding the components and features of the diagram, students can gain insights into the properties of stars and their life cycles. The practical applications of the H-R diagram are numerous, ranging from stellar evolution to galaxy evolution and exoplanet detection. As astronomy students continue to explore the universe, the H-R diagram will remain an essential tool in their toolkit.
What is the main sequence on the H-R diagram?
+The main sequence is a diagonal line on the H-R diagram that represents the stage at which stars are fusing hydrogen into helium in their cores.
What is the red giant branch on the H-R diagram?
+The red giant branch is a curved line on the H-R diagram that represents the stage at which stars have exhausted their hydrogen fuel and have expanded to become red giants.
What is the white dwarf cooling track on the H-R diagram?
+The white dwarf cooling track is a diagonal line on the H-R diagram that represents the stage at which stars have exhausted their fuel and have shed their outer layers, leaving behind a hot, compact core.


