Mastering Polynomial Graphs in 5 Easy Steps

Understanding Polynomial Graphs
Polynomial graphs are a fundamental concept in algebra and are used to visualize the relationship between the input (x) and output (y) of a polynomial function. Polynomial functions are composed of variables and coefficients combined using only addition, subtraction, and multiplication, and the variables are always raised to a non-negative power. Graphing polynomial functions can help us understand their behavior, identify patterns, and make predictions.
Step 1: Identify the Degree and Leading Coefficient
To master polynomial graphs, the first step is to identify the degree and leading coefficient of the polynomial function. The degree of a polynomial is the highest power of the variable (x), and the leading coefficient is the coefficient of the term with the highest power of x.
For example, in the polynomial function f(x) = 3x^4 + 2x^3 - x^2 + 1, the degree is 4, and the leading coefficient is 3. This information will help us determine the end behavior of the graph.
📝 Note: The degree of a polynomial is always a positive integer.
Step 2: Determine the End Behavior
The end behavior of a polynomial graph refers to what happens to the graph as x approaches positive or negative infinity. The degree and leading coefficient of the polynomial determine the end behavior.
- If the degree is even (e.g., 2, 4, 6), the graph will either rise or fall on both ends.
- If the degree is odd (e.g., 1, 3, 5), the graph will rise on one end and fall on the other.
- If the leading coefficient is positive, the graph will rise on the right end.
- If the leading coefficient is negative, the graph will fall on the right end.
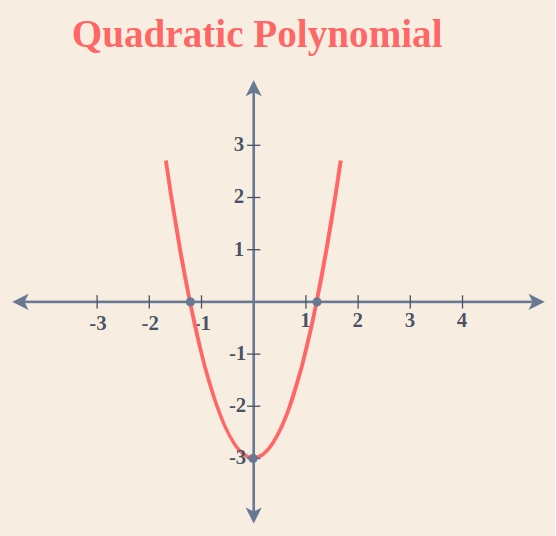
Using the example from Step 1, since the degree is 4 (even) and the leading coefficient is 3 (positive), the graph will rise on both ends.
Step 3: Find the Zeros and Turning Points
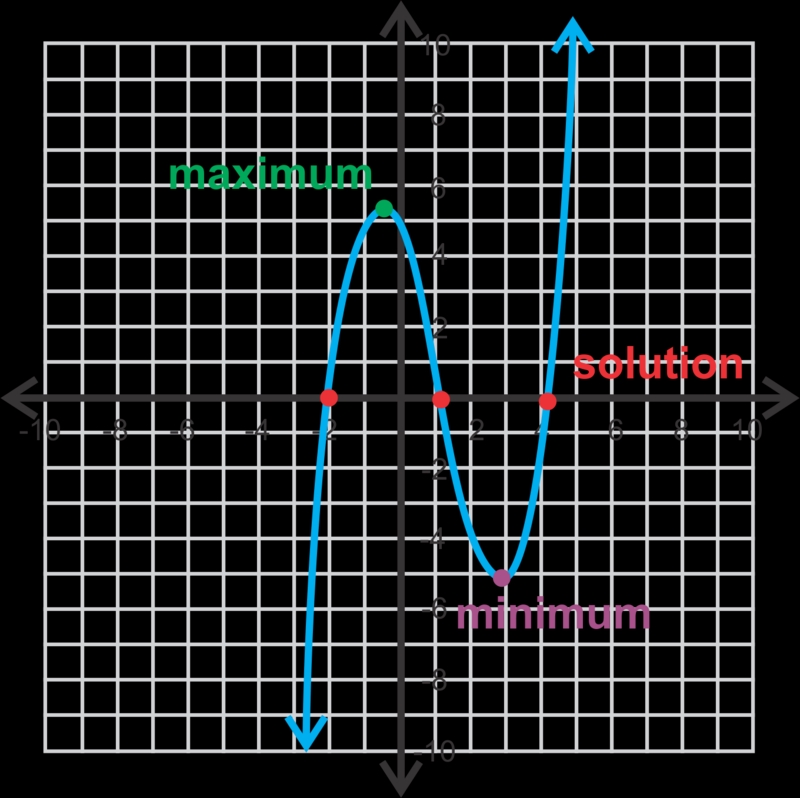
The zeros of a polynomial function are the values of x that make the function equal to zero. These values can be found by factoring or using the quadratic formula. The turning points of a polynomial graph are the points where the graph changes direction.
To find the zeros and turning points, we need to factor the polynomial function, if possible, and use the factored form to identify the zeros. We can also use the first derivative of the function to find the turning points.
For example, if we have the polynomial function f(x) = x^3 - 6x^2 + 11x - 6, we can factor it as f(x) = (x - 1)(x - 2)(x - 3). The zeros are x = 1, x = 2, and x = 3.
Step 4: Graph the Polynomial Function
Now that we have identified the degree, leading coefficient, end behavior, zeros, and turning points, we can graph the polynomial function. We can use a graphing calculator or software to visualize the graph.
Here are some tips to keep in mind when graphing polynomial functions:
- Use a grid to help you plot the points accurately.
- Plot the zeros and turning points first.
- Use the end behavior to determine the direction of the graph on both ends.
- Use a smooth curve to connect the points.
Step 5: Analyze the Graph
The final step is to analyze the graph and interpret the results. We can use the graph to identify patterns, make predictions, and understand the behavior of the polynomial function.
Some common patterns to look for in polynomial graphs include:
- Symmetry: If the graph is symmetric about the y-axis, the function is even. If the graph is symmetric about the origin, the function is odd.
- Cusps: A cusp is a sharp point on the graph where the function changes direction. Cusps occur when the derivative of the function is zero.
- Inflection points: An inflection point is a point on the graph where the function changes from concave to convex or vice versa.
By following these 5 easy steps, you can master polynomial graphs and gain a deeper understanding of algebraic functions.
To illustrate the concepts discussed in this article, consider the following table:

| Polynomial Function | Degree | Leading Coefficient | End Behavior |
|---|---|---|---|
| f(x) = x^4 + 2x^3 - x^2 + 1 | 4 | 1 | Rise on both ends |
| f(x) = -x^3 + 2x^2 - x + 1 | 3 | -1 | Fall on the right end, rise on the left end |
| f(x) = x^2 + 2x + 1 | 2 | 1 | Rise on both ends |
In conclusion, mastering polynomial graphs requires a deep understanding of algebraic functions and their properties. By following the 5 easy steps outlined in this article, you can develop a strong foundation in graphing polynomial functions and analyzing their behavior.
What is the degree of a polynomial function?
+The degree of a polynomial function is the highest power of the variable (x) in the function.
How do I determine the end behavior of a polynomial graph?
+The end behavior of a polynomial graph depends on the degree and leading coefficient of the function. If the degree is even, the graph will either rise or fall on both ends. If the degree is odd, the graph will rise on one end and fall on the other.
What are the zeros and turning points of a polynomial function?
+The zeros of a polynomial function are the values of x that make the function equal to zero. The turning points are the points where the graph changes direction.


