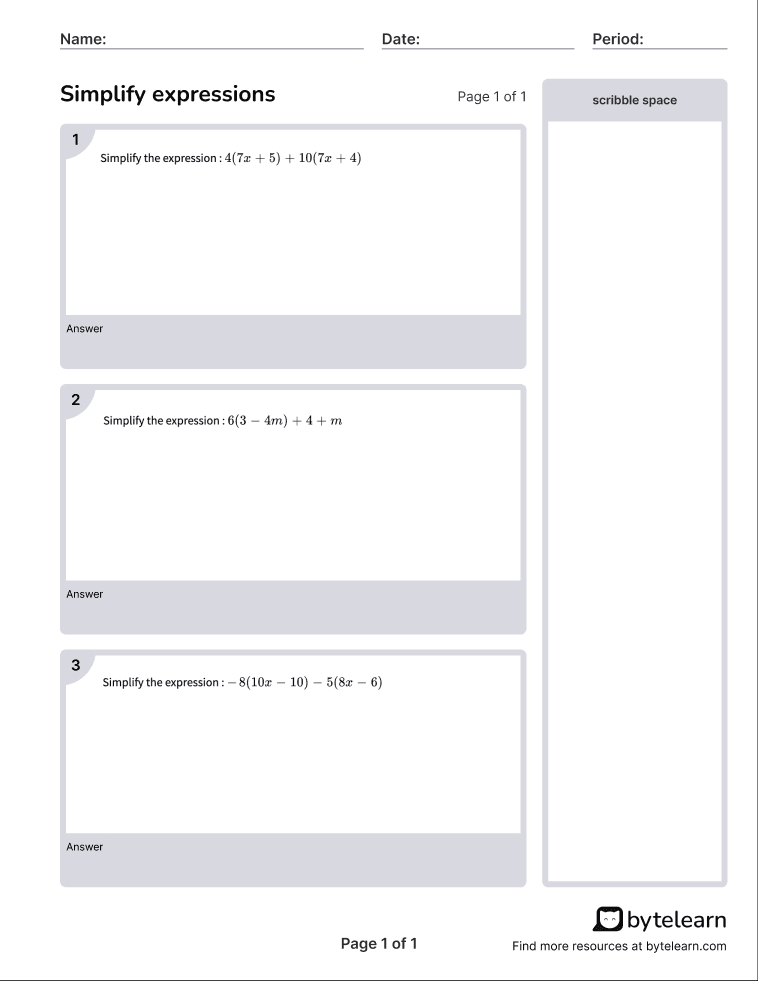
Graphing Slope Worksheet
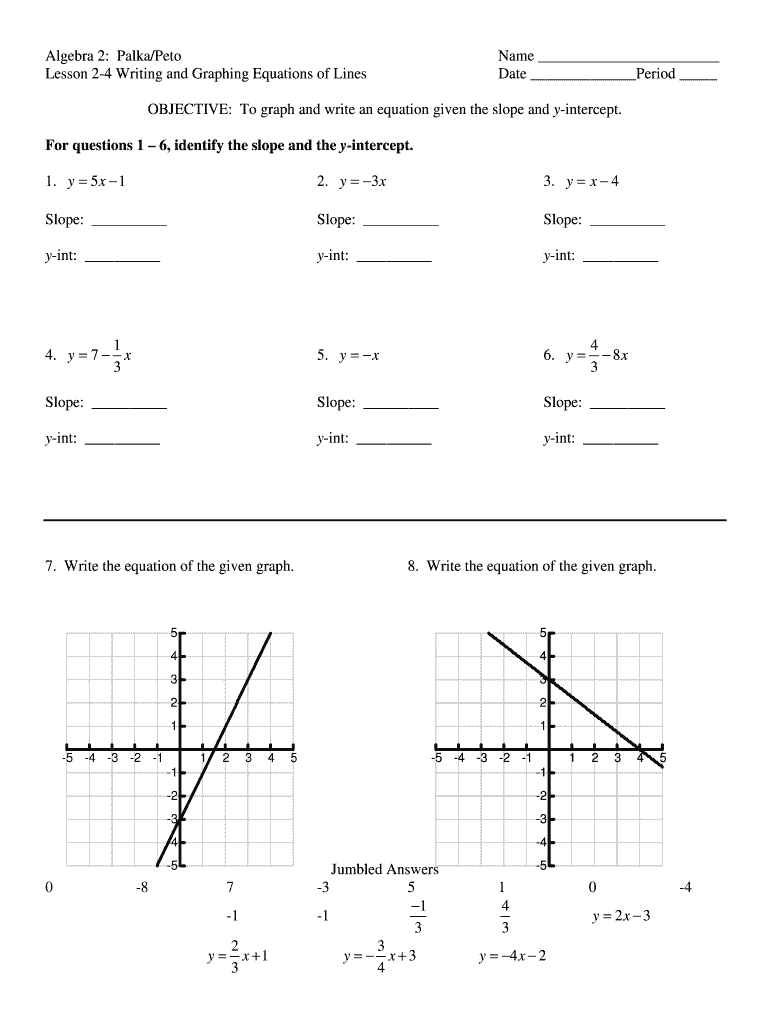
Understanding Slope and Graphing Lines
Graphing slope is a fundamental concept in mathematics, especially in algebra and geometry. It helps in understanding the relationship between the x and y coordinates of a line. In this post, we will explore the concept of slope, its types, and how to graph lines using the slope-intercept form.
What is Slope?
Slope is a measure of how steep a line is. It is calculated as the ratio of the vertical change (rise) to the horizontal change (run) between two points on the line. The formula for slope is:
m = (y2 - y1) / (x2 - x1)
where m is the slope, (x1, y1) and (x2, y2) are two points on the line.
Types of Slope
There are several types of slope, including:
- Positive Slope: A line with a positive slope rises from left to right.
- Negative Slope: A line with a negative slope falls from left to right.
- Zero Slope: A line with a zero slope is horizontal and has no rise or fall.
- Undefined Slope: A line with an undefined slope is vertical and has no run.
Slope-Intercept Form
The slope-intercept form of a line is y = mx + b, where m is the slope and b is the y-intercept. The y-intercept is the point where the line crosses the y-axis.
📝 Note: The slope-intercept form is useful for graphing lines because it provides the slope and y-intercept, which can be used to plot the line.
Graphing Lines Using Slope-Intercept Form
To graph a line using the slope-intercept form, follow these steps:
- Plot the y-intercept (b) on the y-axis.
- Use the slope (m) to find another point on the line. For example, if the slope is 2, move 2 units up and 1 unit right from the y-intercept.
- Draw a line through the two points.
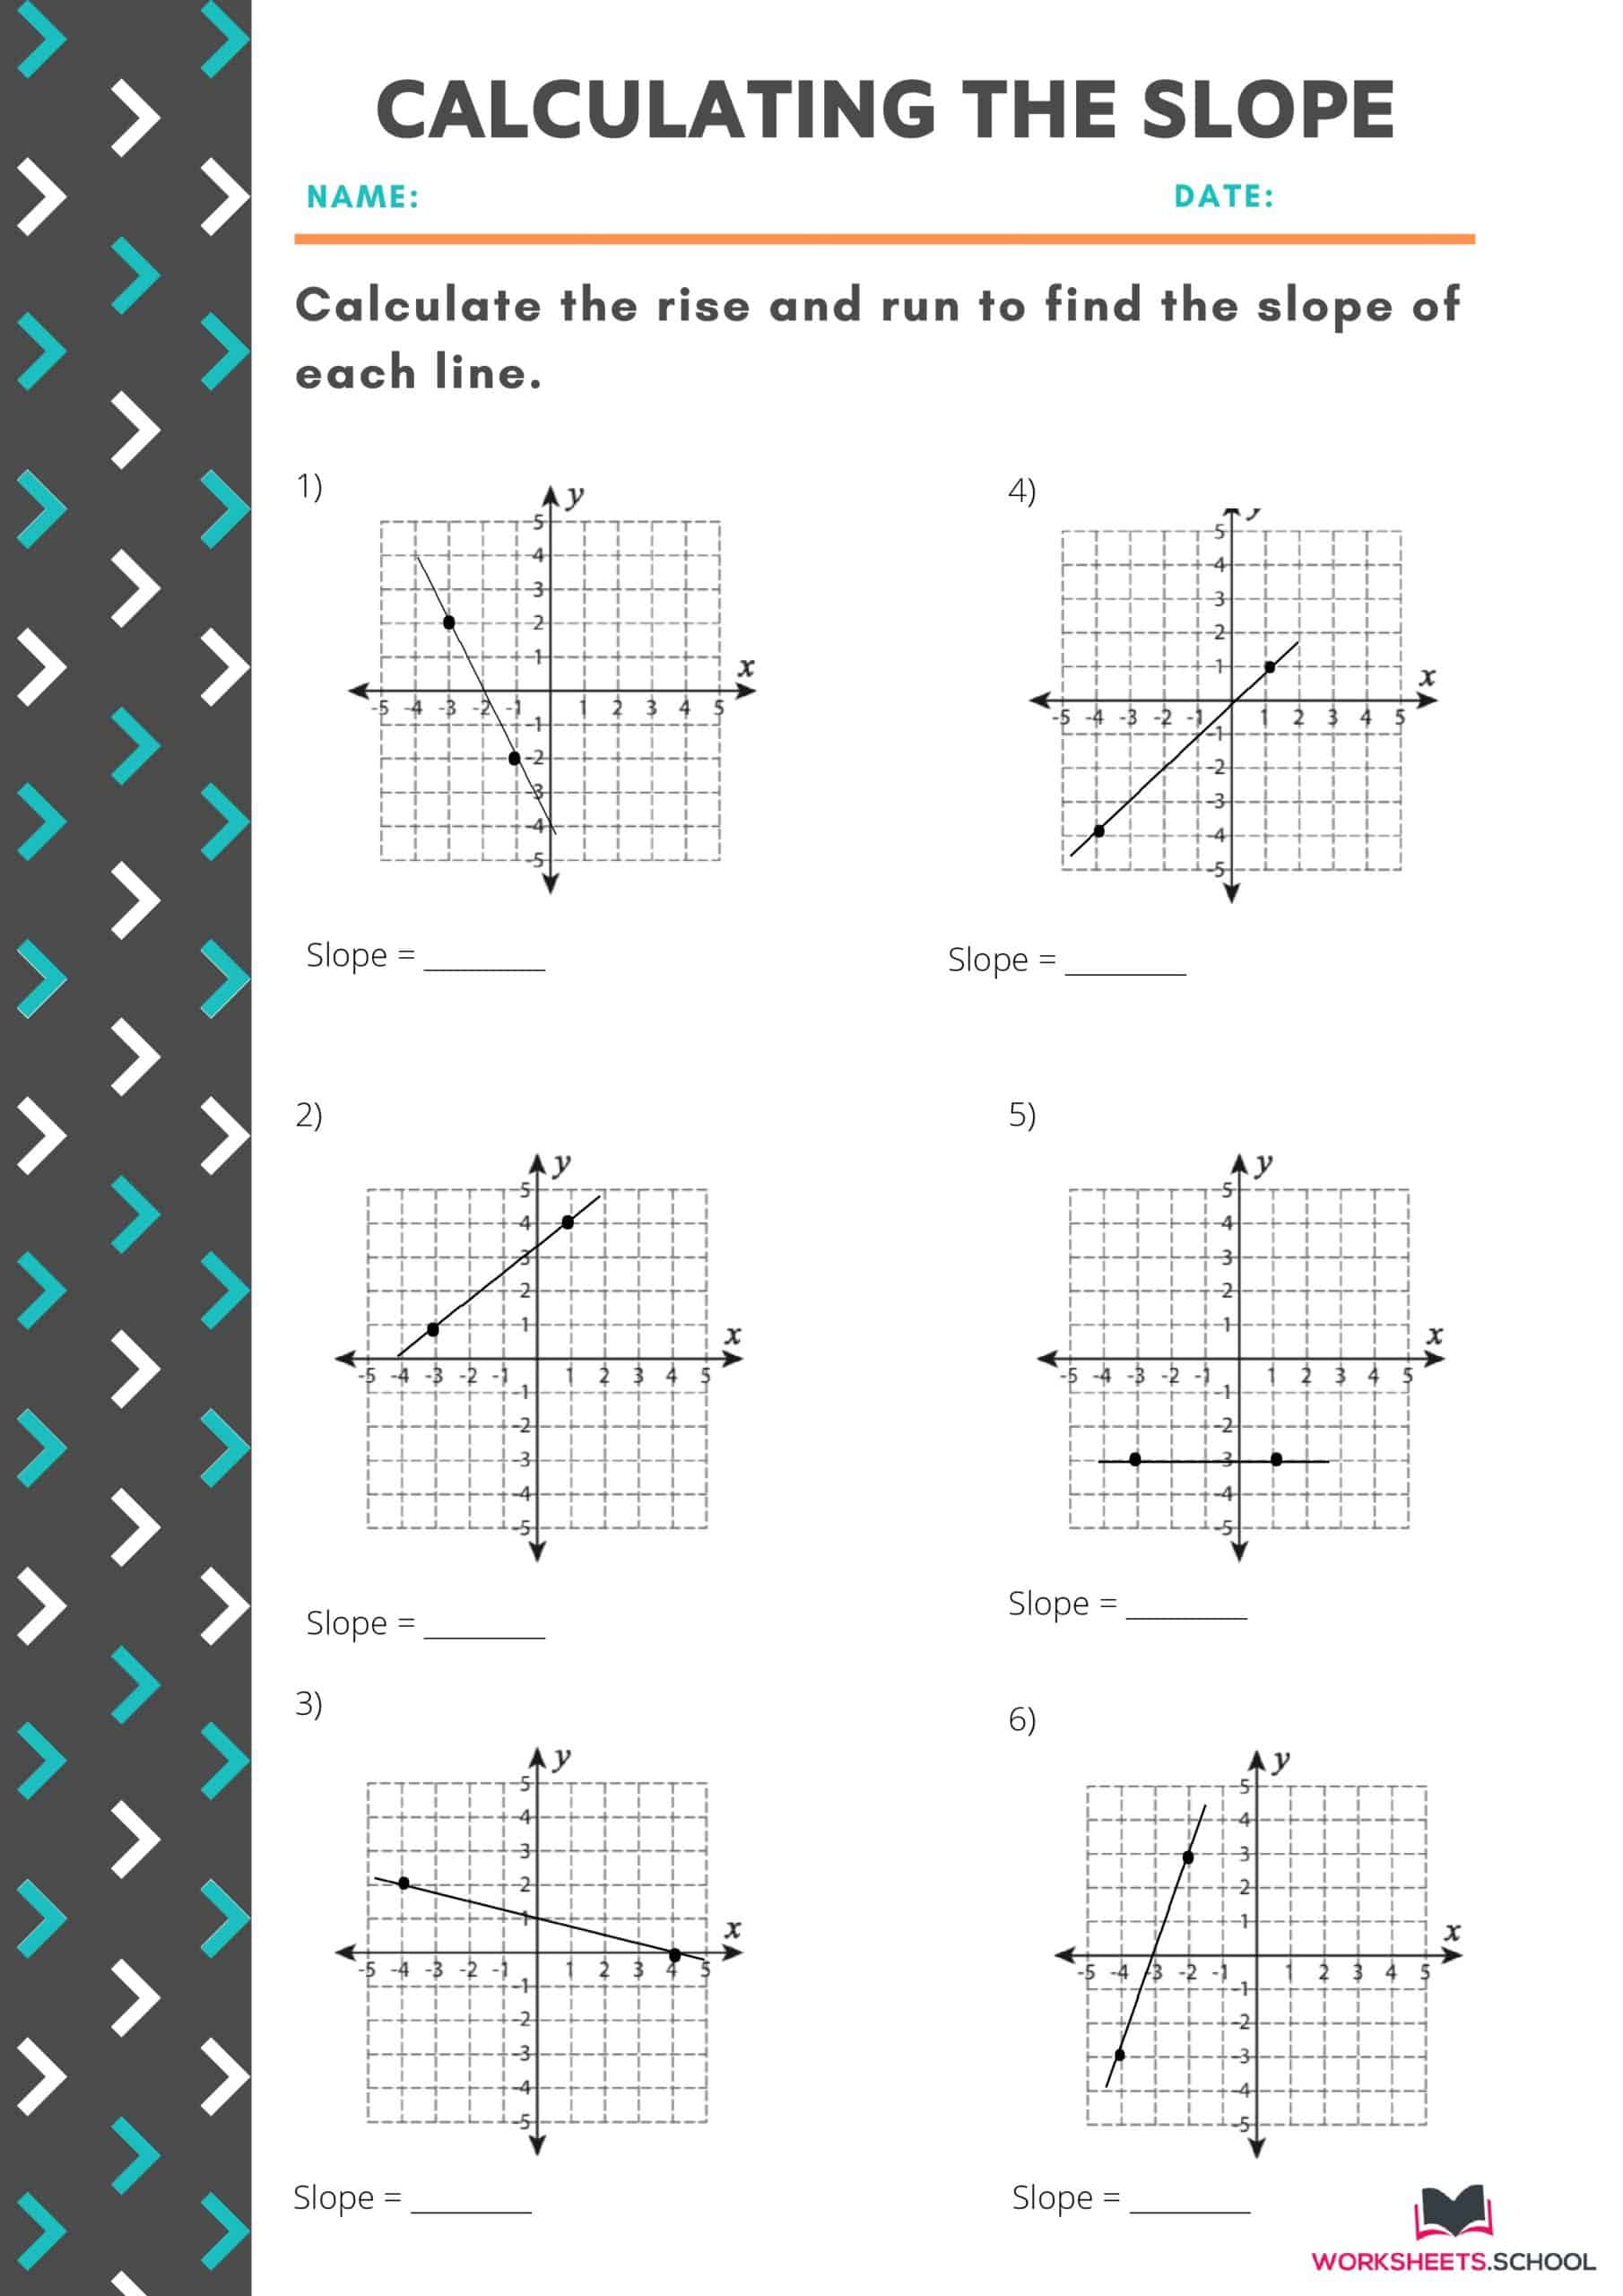
| Slope | y-Intercept | Graph |
|---|---|---|
| 2 | 3 | A line with a positive slope, crossing the y-axis at (0, 3) |
| -1 | -2 | A line with a negative slope, crossing the y-axis at (0, -2) |
| 0 | 4 | A horizontal line, crossing the y-axis at (0, 4) |
Practice Graphing Slope
Now that you have learned how to graph lines using the slope-intercept form, practice graphing the following lines:
- y = 2x + 1
- y = -3x - 2
- y = x - 4
- y = 0.5x + 3
📝 Note: Use graph paper to plot the lines and check your work.
As you can see, graphing slope is a straightforward process that requires understanding the slope-intercept form and using it to plot lines. With practice, you will become more comfortable graphing lines and understanding their relationships.
The concept of slope and graphing lines is essential in various fields, including physics, engineering, and economics. By mastering this concept, you will be able to analyze and visualize data, making informed decisions in your chosen field.
What is the slope-intercept form of a line?
+The slope-intercept form of a line is y = mx + b, where m is the slope and b is the y-intercept.
How do I graph a line using the slope-intercept form?
+To graph a line using the slope-intercept form, plot the y-intercept (b) on the y-axis, then use the slope (m) to find another point on the line, and finally draw a line through the two points.
What is the difference between a positive and negative slope?
+A line with a positive slope rises from left to right, while a line with a negative slope falls from left to right.
Related Terms:
- Slope Worksheet PDF
- Graphing slope-intercept form worksheet
- Graphing Linear equations Worksheet PDF
