6 Ways to Master Graphing Slope Intercept Form

Understanding Slope Intercept Form
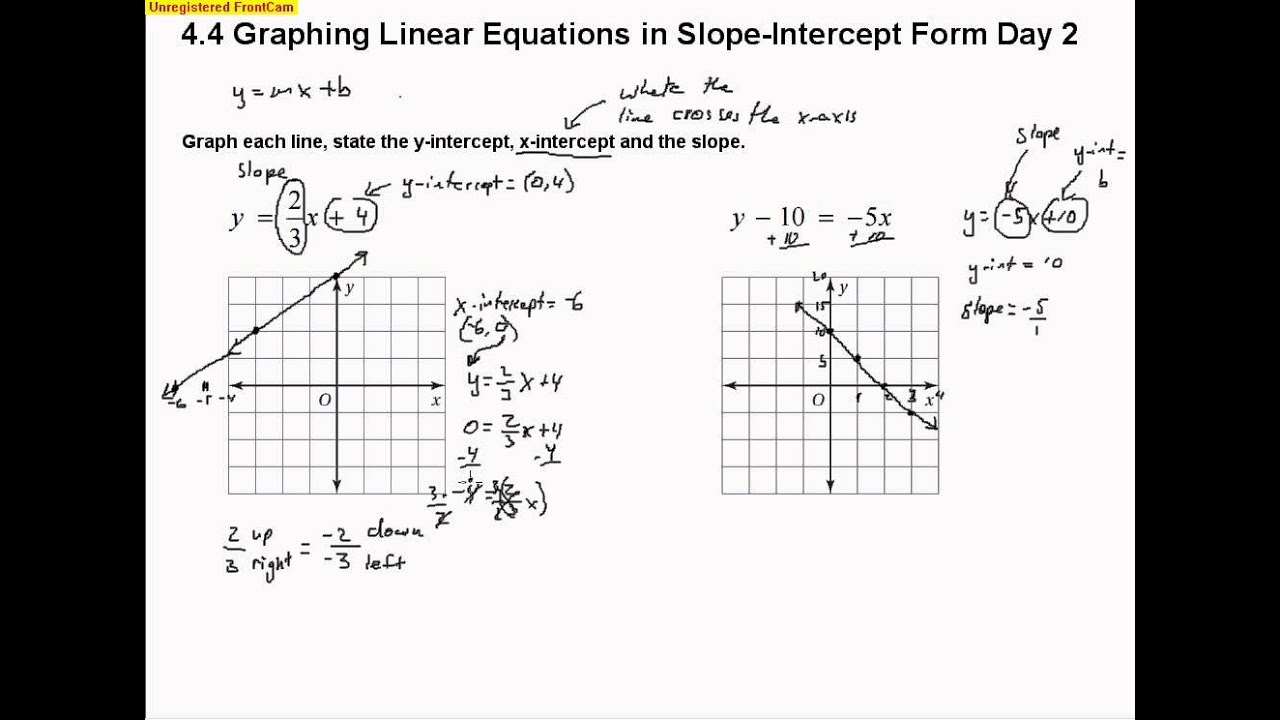
Graphing slope intercept form is a fundamental concept in mathematics, particularly in algebra and geometry. The slope intercept form of a linear equation is y = mx + b, where m is the slope of the line and b is the y-intercept. Mastering graphing slope intercept form is crucial for solving equations, graphing lines, and understanding relationships between variables.
6 Ways to Master Graphing Slope Intercept Form
Here are six effective ways to master graphing slope intercept form:
1. Understand the Concept of Slope
The slope (m) represents the rate of change of the line. A positive slope indicates a rising line, while a negative slope indicates a falling line. A slope of zero represents a horizontal line, and an undefined slope represents a vertical line. Understanding the concept of slope is essential for graphing slope intercept form.
2. Identify the Y-Intercept
The y-intercept (b) is the point where the line intersects the y-axis. Identifying the y-intercept is crucial for graphing slope intercept form, as it provides the starting point for the line. To find the y-intercept, set x = 0 and solve for y.
3. Plot the Y-Intercept
Plotting the y-intercept is the first step in graphing slope intercept form. Mark the y-intercept on the y-axis and label it as (0, b).
4. Use the Slope to Find Another Point
Using the slope, find another point on the line. The slope can be used to determine the rise (change in y) and run (change in x). For example, if the slope is 2⁄3, the rise is 2 units and the run is 3 units. Plot this point on the graph.
5. Draw the Line
Using the y-intercept and the second point, draw the line. Make sure the line is straight and passes through both points.
6. Check Your Work
Checking your work is essential for ensuring accuracy. Plug in values for x and y to verify that the line is correct.
📝 Note: It's essential to label the x and y axes and provide a title for the graph to ensure clarity and understanding.
Example:
Graph the equation y = 2x + 3 using slope intercept form.
- Identify the y-intercept: b = 3
- Plot the y-intercept: (0, 3)
- Use the slope to find another point: rise = 2, run = 1; plot the point (1, 5)
- Draw the line: pass the line through (0, 3) and (1, 5)
- Check your work: verify that the line passes through both points and is straight.
What is the slope intercept form of a linear equation?
+The slope intercept form of a linear equation is y = mx + b, where m is the slope and b is the y-intercept.
How do I find the y-intercept?
+To find the y-intercept, set x = 0 and solve for y.
What is the significance of the slope?
+The slope represents the rate of change of the line. A positive slope indicates a rising line, while a negative slope indicates a falling line.
By mastering these six steps, you’ll be well on your way to graphing slope intercept form with confidence. Remember to practice regularly to reinforce your understanding of this fundamental concept.


