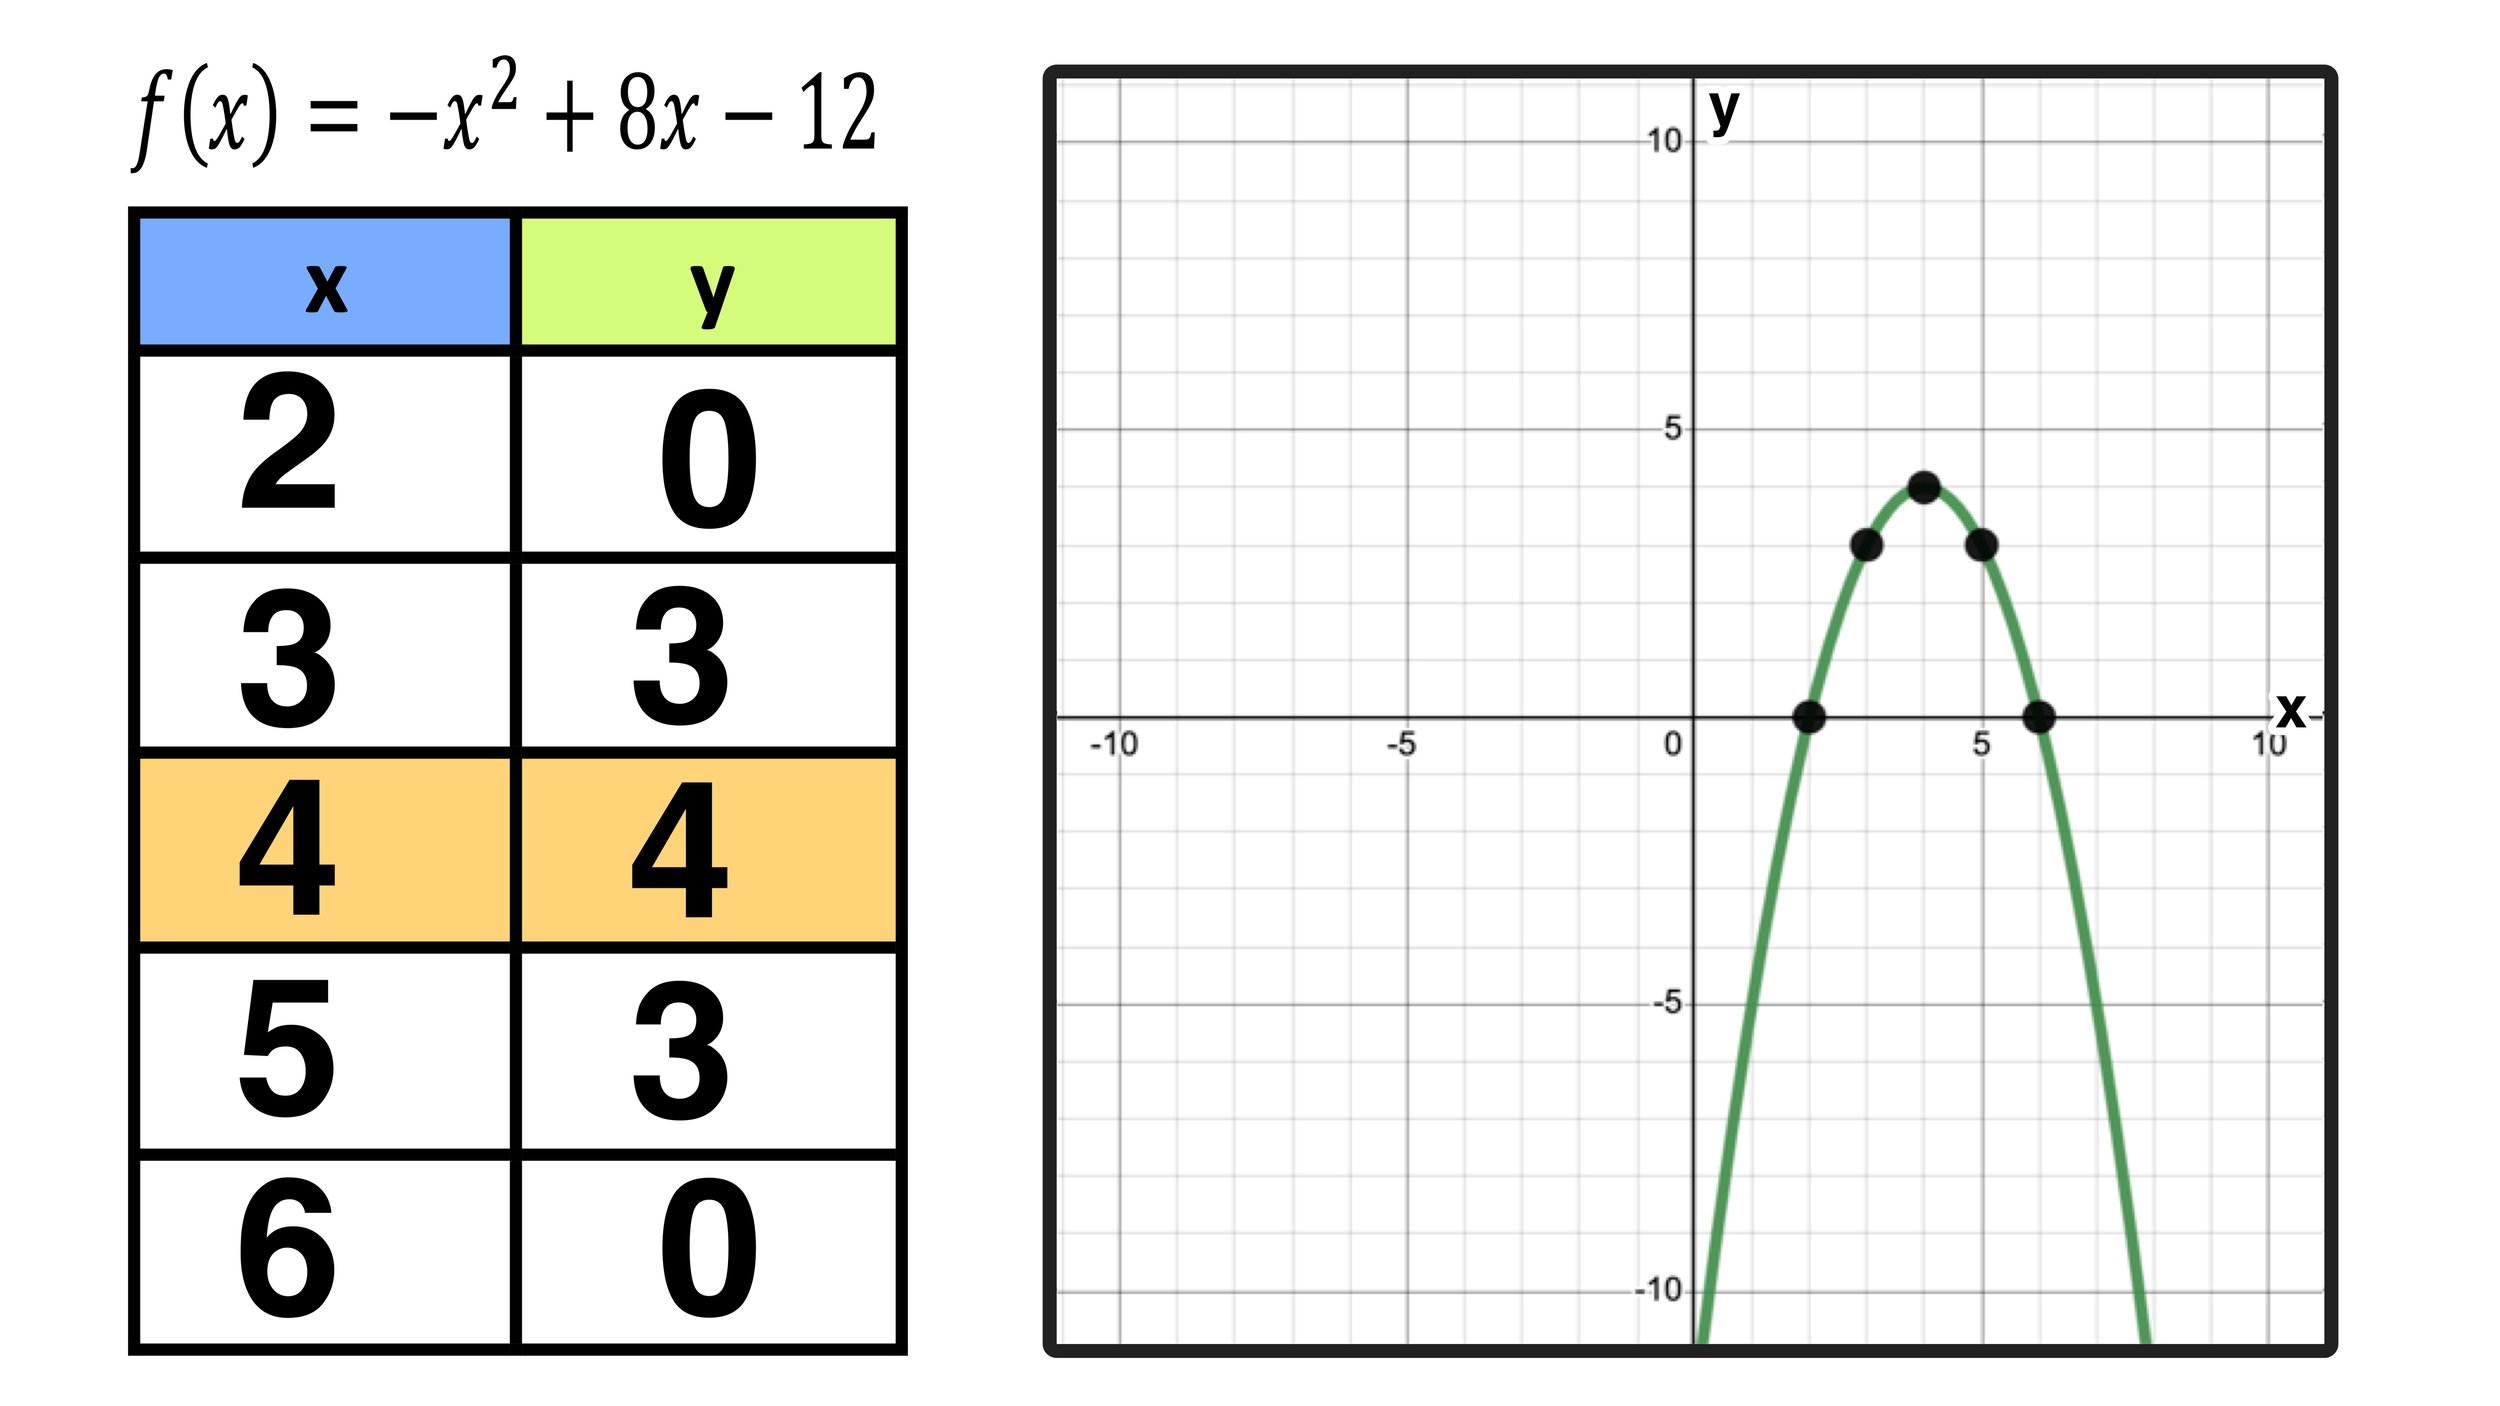
Graphing Quadratic Functions Made Easy with This Worksheet

Understanding Quadratic Functions
Quadratic functions are a fundamental concept in algebra and are used to model a wide range of real-world phenomena, from the trajectory of a thrown ball to the shape of a satellite dish. A quadratic function is a polynomial function of degree two, which means the highest power of the variable (usually x) is two. The general form of a quadratic function is:
f(x) = ax^2 + bx + c
where a, b, and c are constants.
Why Graph Quadratic Functions?
Graphing quadratic functions is an essential skill in mathematics, as it allows us to visualize the behavior of the function and understand its key features. By graphing a quadratic function, we can identify:
- The vertex (the lowest or highest point on the graph)
- The axis of symmetry (the line that divides the graph into two mirror-image halves)
- The x-intercepts (the points where the graph crosses the x-axis)
- The y-intercept (the point where the graph crosses the y-axis)
Step-by-Step Guide to Graphing Quadratic Functions
Graphing a quadratic function can seem daunting, but it can be broken down into a series of simple steps. Here’s a step-by-step guide to get you started:
Step 1: Identify the Vertex
The vertex of a quadratic function is the lowest or highest point on the graph. To find the vertex, use the formula:
x = -b / 2a
Plug in the values of a and b from the quadratic function, and solve for x.
Step 2: Find the Axis of Symmetry
The axis of symmetry is the line that divides the graph into two mirror-image halves. The axis of symmetry is always vertical and passes through the vertex. To find the axis of symmetry, use the formula:
x = -b / 2a
This will give you the x-coordinate of the axis of symmetry.
Step 3: Identify the X-Intercepts
The x-intercepts are the points where the graph crosses the x-axis. To find the x-intercepts, set the quadratic function equal to zero and solve for x:
ax^2 + bx + c = 0
Use the quadratic formula or factor the quadratic expression to find the x-intercepts.
Step 4: Find the Y-Intercept
The y-intercept is the point where the graph crosses the y-axis. To find the y-intercept, plug in x = 0 into the quadratic function:
f(0) = a(0)^2 + b(0) + c = c
So, the y-intercept is simply the value of c.
📝 Note: Make sure to label the vertex, axis of symmetry, x-intercepts, and y-intercept on your graph.
Example: Graphing a Quadratic Function
Let’s graph the quadratic function:
f(x) = x^2 + 4x + 4
Step 1: Identify the Vertex
x = -b / 2a = -4 / 2(1) = -2
So, the vertex is at x = -2.
Step 2: Find the Axis of Symmetry
x = -b / 2a = -4 / 2(1) = -2
So, the axis of symmetry is x = -2.
Step 3: Identify the X-Intercepts
x^2 + 4x + 4 = 0 (x + 2)(x + 2) = 0 x + 2 = 0 x = -2
So, the x-intercept is at x = -2.
Step 4: Find the Y-Intercept
f(0) = (0)^2 + 4(0) + 4 = 4
So, the y-intercept is at y = 4.
Graphing the Function
Using the information we’ve gathered, we can graph the quadratic function:

Conclusion
Graphing quadratic functions is a crucial skill in mathematics, and with practice, you’ll become proficient in no time. Remember to follow the step-by-step guide, and don’t be afraid to ask for help if you need it. Happy graphing!
What is the general form of a quadratic function?
+The general form of a quadratic function is f(x) = ax^2 + bx + c, where a, b, and c are constants.
How do I find the vertex of a quadratic function?
+To find the vertex, use the formula x = -b / 2a.
What is the axis of symmetry?
+The axis of symmetry is the line that divides the graph into two mirror-image halves. It is always vertical and passes through the vertex.


