7 Ways to Graph Lines in Standard Form

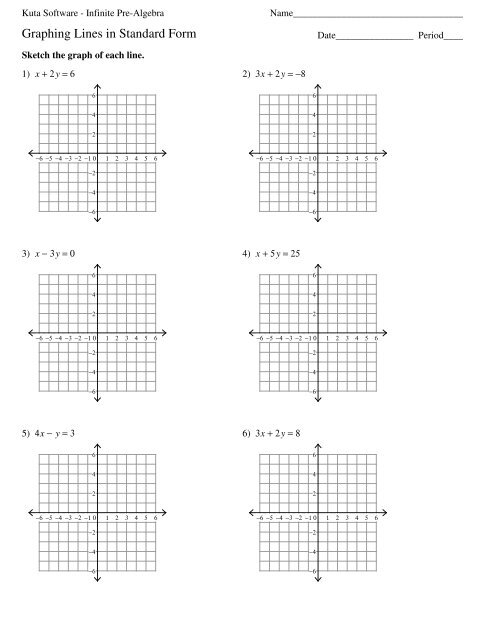
Graphing Lines in Standard Form
Graphing lines in standard form is a fundamental concept in mathematics, particularly in algebra and geometry. The standard form of a linear equation is Ax + By = C, where A, B, and C are constants. In this article, we will explore seven ways to graph lines in standard form, making it easier for you to visualize and understand linear equations.
Understanding Standard Form
Before diving into the graphing techniques, it’s essential to understand the standard form of a linear equation. The standard form is a way of writing a linear equation in a specific format, where:
- A is the coefficient of x
- B is the coefficient of y
- C is the constant term
For example, the equation 2x + 3y = 5 is in standard form, where A = 2, B = 3, and C = 5.
Method 1: Plotting Two Points
One of the simplest ways to graph a line in standard form is by plotting two points on the coordinate plane. To do this:
- Choose any value for x and solve for y
- Plot the point (x, y) on the coordinate plane
- Repeat the process with a different value of x
- Plot the second point (x, y) on the coordinate plane
- Draw a line through the two points
For example, let’s graph the equation x + 2y = 4 using this method.

| x | y |
|---|---|
| 0 | 2 |
| 2 | 1 |
Plot the points (0, 2) and (2, 1) on the coordinate plane and draw a line through them.
📝 Note: Make sure to choose values of x that are easy to work with, such as 0 or 1.
Method 2: Finding the X- and Y-Intercepts
Another way to graph a line in standard form is by finding the x- and y-intercepts. To do this:
- Set x = 0 and solve for y to find the y-intercept
- Set y = 0 and solve for x to find the x-intercept
- Plot the points (x, y) on the coordinate plane
- Draw a line through the two points
For example, let’s graph the equation 2x + 3y = 6 using this method.
- Set x = 0 and solve for y: 3y = 6 → y = 2
- Set y = 0 and solve for x: 2x = 6 → x = 3
Plot the points (0, 2) and (3, 0) on the coordinate plane and draw a line through them.
📝 Note: Make sure to label the x- and y-intercepts on the coordinate plane.
Method 3: Using the Slope-Intercept Form
If you’re familiar with the slope-intercept form of a linear equation (y = mx + b), you can use this method to graph a line in standard form. To do this:
- Convert the standard form equation to slope-intercept form
- Identify the slope (m) and the y-intercept (b)
- Use the slope to determine the direction of the line
- Plot the y-intercept on the coordinate plane
- Draw a line with the correct slope through the y-intercept
For example, let’s graph the equation x + 2y = 4 using this method.
- Convert to slope-intercept form: 2y = -x + 4 → y = (-1⁄2)x + 2
- Identify the slope (m = -1⁄2) and the y-intercept (b = 2)
- Use the slope to determine the direction of the line
- Plot the y-intercept (0, 2) on the coordinate plane
- Draw a line with a slope of -1⁄2 through the y-intercept
Method 4: Graphing with a Table of Values
You can also graph a line in standard form by creating a table of values. To do this:
- Create a table with values of x and corresponding values of y
- Plot the points (x, y) on the coordinate plane
- Draw a line through the points
For example, let’s graph the equation 2x + 3y = 5 using this method.
| x | y |
|---|---|
| 0 | 1.67 |
| 1 | 1.33 |
| 2 | 1 |
Plot the points (0, 1.67), (1, 1.33), and (2, 1) on the coordinate plane and draw a line through them.
📝 Note: Make sure to choose values of x that are easy to work with.
Method 5: Using Graphing Technology
If you have access to graphing technology, such as a graphing calculator or online graphing tool, you can use it to graph a line in standard form. To do this:
- Enter the equation into the graphing technology
- Adjust the window settings as needed
- Graph the equation
For example, let’s graph the equation x + 2y = 4 using a graphing calculator.
- Enter the equation into the calculator
- Adjust the window settings to ensure the entire line is visible
- Graph the equation
Method 6: Graphing with Intercepts and Slope
This method combines the techniques of finding the x- and y-intercepts and using the slope to graph a line. To do this:
- Find the x- and y-intercepts
- Calculate the slope (m) using the formula m = (y2 - y1) / (x2 - x1)
- Use the slope to determine the direction of the line
- Plot the x- and y-intercepts on the coordinate plane
- Draw a line with the correct slope through the intercepts
For example, let’s graph the equation 2x + 3y = 5 using this method.
- Find the x- and y-intercepts: (0, 1.67) and (2.5, 0)
- Calculate the slope: m = (0 - 1.67) / (2.5 - 0) = -0.67
- Use the slope to determine the direction of the line
- Plot the intercepts on the coordinate plane
- Draw a line with a slope of -0.67 through the intercepts
Method 7: Graphing with a Ruler and Protractor
This method uses a ruler and protractor to graph a line in standard form. To do this:
- Create a coordinate plane on a piece of paper
- Plot the x- and y-intercepts on the coordinate plane
- Use a protractor to draw a line with the correct slope through the intercepts
- Use a ruler to extend the line through the intercepts
For example, let’s graph the equation x + 2y = 4 using this method.
- Create a coordinate plane on a piece of paper
- Plot the x- and y-intercepts: (0, 2) and (2, 0)
- Use a protractor to draw a line with a slope of -1⁄2 through the intercepts
- Use a ruler to extend the line through the intercepts
In conclusion, there are many ways to graph lines in standard form, each with its own advantages and disadvantages. By understanding the different methods, you can choose the one that works best for you and become proficient in graphing lines in standard form.
What is the standard form of a linear equation?
+The standard form of a linear equation is Ax + By = C, where A, B, and C are constants.
What is the slope-intercept form of a linear equation?
+The slope-intercept form of a linear equation is y = mx + b, where m is the slope and b is the y-intercept.
What is the difference between the x- and y-intercepts?
+The x-intercept is the point where the line crosses the x-axis, while the y-intercept is the point where the line crosses the y-axis.
Can I use graphing technology to graph a line in standard form?
+Related Terms:
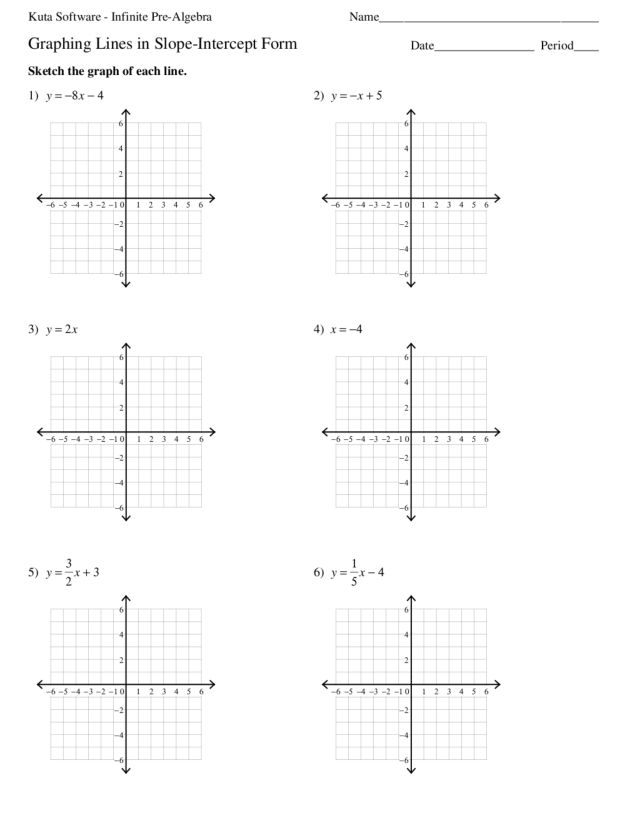
- Graphing Lines in slope intercept form


