7 Ways to Master Graphing Linear Equations

Understanding the Basics of Linear Equations
Linear equations are a fundamental concept in algebra and are used to describe relationships between variables. A linear equation is an equation in which the highest power of the variable(s) is 1. In this article, we will explore 7 ways to master graphing linear equations, which is an essential skill for anyone studying algebra or preparing for standardized tests.
Method 1: Slope-Intercept Form
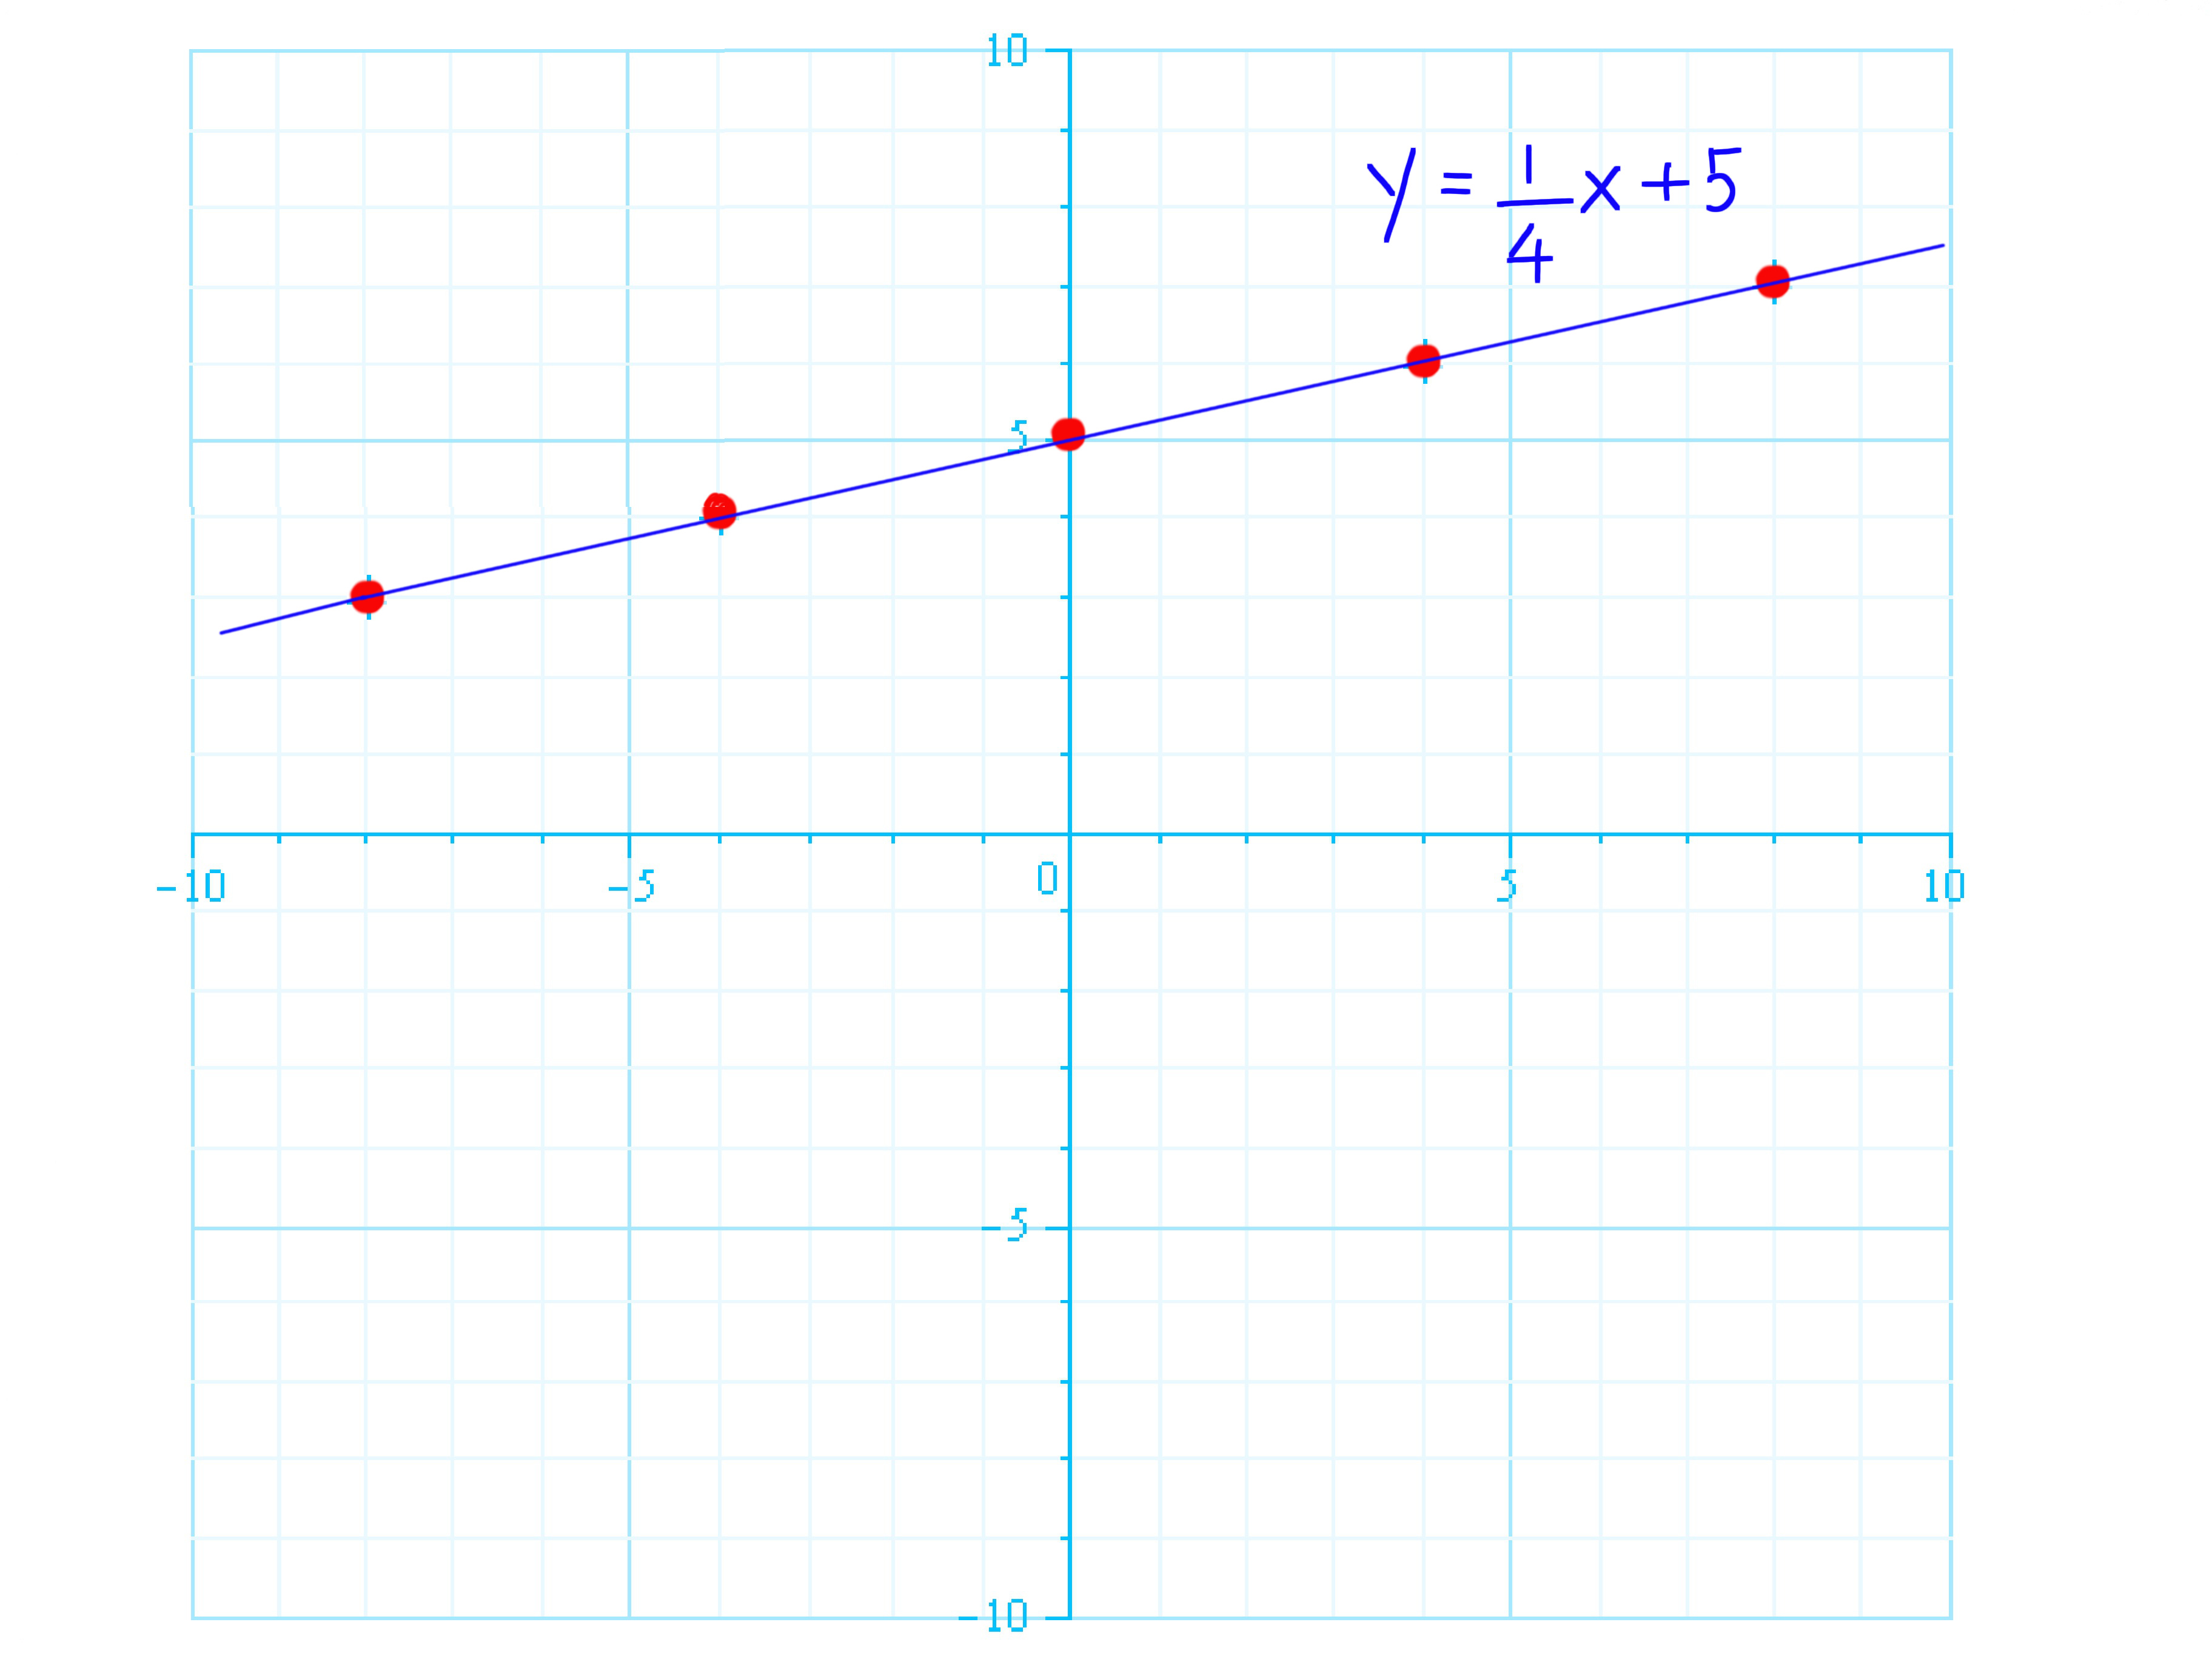
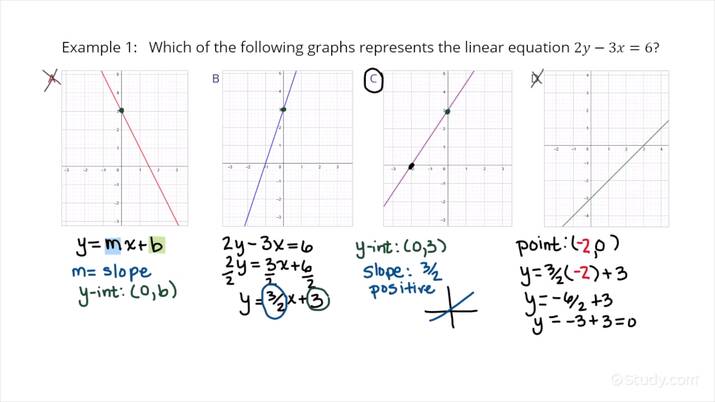
The slope-intercept form of a linear equation is y = mx + b, where m is the slope and b is the y-intercept. This form makes it easy to graph a linear equation, as you can identify the slope and y-intercept from the equation. To graph a linear equation in slope-intercept form, follow these steps:
- Identify the slope (m) and y-intercept (b) from the equation.
- Plot the y-intercept on the graph.
- Use the slope to find another point on the graph. For example, if the slope is 2, move 2 units up and 1 unit right from the y-intercept.
- Draw a line through the two points to create the graph.
📝 Note: Make sure to label the x and y axes and include a title for the graph.
Method 2: Standard Form
The standard form of a linear equation is Ax + By = C, where A, B, and C are constants. This form is useful when you need to find the x-intercept or when the equation is not easily convertible to slope-intercept form. To graph a linear equation in standard form, follow these steps:
- Identify the x-intercept by setting y = 0 and solving for x.
- Identify the y-intercept by setting x = 0 and solving for y.
- Plot the x and y intercepts on the graph.
- Use the intercepts to draw a line through them.
Method 3: Point-Slope Form
The point-slope form of a linear equation is y - y1 = m(x - x1), where (x1, y1) is a point on the line and m is the slope. This form is useful when you know a point on the line and the slope. To graph a linear equation in point-slope form, follow these steps:
- Identify the point (x1, y1) and the slope (m) from the equation.
- Plot the point on the graph.
- Use the slope to find another point on the graph. For example, if the slope is 2, move 2 units up and 1 unit right from the point.
- Draw a line through the two points to create the graph.
Method 4: Graphing Using a Table of Values
Another way to graph a linear equation is by creating a table of values. This method is useful when you need to graph a complex equation or when you don’t have a specific form of the equation. To graph a linear equation using a table of values, follow these steps:
- Choose several x-values and substitute them into the equation to find the corresponding y-values.
- Create a table with the x and y values.
- Plot the points on the graph.
- Draw a line through the points to create the graph.

| x | y |
|---|---|
| -2 | 3 |
| -1 | 1 |
| 0 | -1 |
| 1 | -3 |
Method 5: Graphing Using Intercepts
Graphing using intercepts is a quick and easy way to graph a linear equation. This method is useful when you know the x and y intercepts of the equation. To graph a linear equation using intercepts, follow these steps:
- Identify the x and y intercepts from the equation.
- Plot the intercepts on the graph.
- Draw a line through the intercepts to create the graph.
📝 Note: Make sure to label the x and y axes and include a title for the graph.
Method 6: Graphing Using a Graphing Calculator
A graphing calculator can be a powerful tool for graphing linear equations. This method is useful when you need to graph a complex equation or when you need to visualize the graph quickly. To graph a linear equation using a graphing calculator, follow these steps:
- Enter the equation into the calculator.
- Adjust the window settings to ensure the entire graph is visible.
- Graph the equation using the calculator’s graphing function.
Method 7: Graphing Using Online Tools
There are many online tools available for graphing linear equations. This method is useful when you don’t have access to a graphing calculator or when you need to visualize the graph quickly. To graph a linear equation using online tools, follow these steps:
- Search for an online graphing tool, such as Desmos or Graphing Calculator.
- Enter the equation into the tool.
- Adjust the settings to ensure the entire graph is visible.
- Graph the equation using the tool.
As you can see, there are many ways to master graphing linear equations. By practicing these methods, you will become more confident and proficient in your ability to graph linear equations.
In summary, graphing linear equations is an essential skill for anyone studying algebra or preparing for standardized tests. By using one of the 7 methods outlined in this article, you can master graphing linear equations and improve your math skills.
What is the slope-intercept form of a linear equation?
+The slope-intercept form of a linear equation is y = mx + b, where m is the slope and b is the y-intercept.
What is the standard form of a linear equation?
+The standard form of a linear equation is Ax + By = C, where A, B, and C are constants.
What is the point-slope form of a linear equation?
+The point-slope form of a linear equation is y - y1 = m(x - x1), where (x1, y1) is a point on the line and m is the slope.


