Graphing Linear Equations Made Easy

Understanding Linear Equations
Linear equations are a fundamental concept in mathematics, and graphing them can be a powerful tool for visualizing and solving problems. A linear equation is an equation in which the highest power of the variable is 1. In other words, it is an equation in which the variable is not squared, cubed, or raised to any higher power.
What is the Standard Form of a Linear Equation?
The standard form of a linear equation is:
Ax + By = C
where:
- A and B are coefficients (numbers)
- x and y are variables
- C is a constant (number)
This form is also known as the general form of a linear equation.
How to Graph a Linear Equation
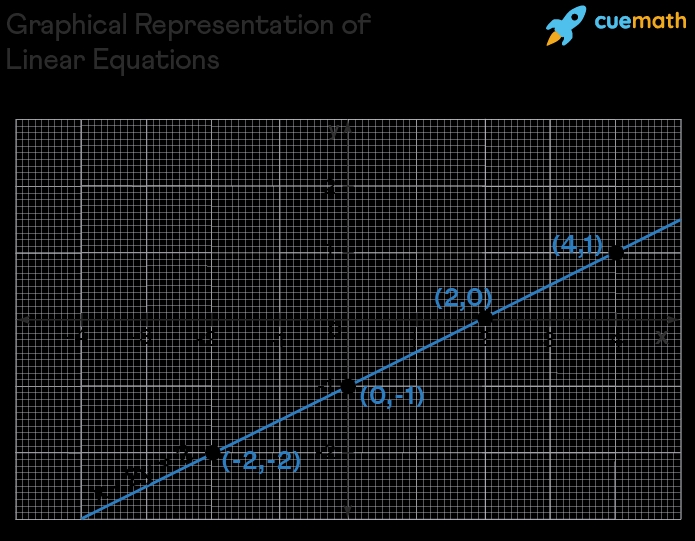
Graphing a linear equation is a straightforward process that can be done by following these steps:
- Determine the x and y intercepts: The x-intercept is the point where the line crosses the x-axis, and the y-intercept is the point where the line crosses the y-axis. To find the x-intercept, set y = 0 and solve for x. To find the y-intercept, set x = 0 and solve for y.
- Choose a third point: Choose a third point that is not on the x or y axis. This point can be found by plugging in a value for x or y and solving for the other variable.
- Plot the points: Plot the x and y intercepts and the third point on a coordinate plane.
- Draw the line: Draw a line through the three points to create the graph of the linear equation.
Using the Slope-Intercept Form
Another way to graph a linear equation is to use the slope-intercept form, which is:
y = mx + b
where:
- m is the slope (a measure of how steep the line is)
- b is the y-intercept (the point where the line crosses the y-axis)
To graph a linear equation in slope-intercept form, follow these steps:
- Plot the y-intercept: Plot the point (0, b) on the coordinate plane.
- Use the slope to find another point: Use the slope to find another point on the line. For example, if the slope is 2, then for every 1 unit to the right, the line goes up 2 units.
- Draw the line: Draw a line through the two points to create the graph of the linear equation.
Example: Graphing a Linear Equation
Let’s graph the linear equation:
2x + 3y = 6
To graph this equation, we can start by finding the x and y intercepts:
- x-intercept: 2x + 3(0) = 6 –> 2x = 6 –> x = 3
- y-intercept: 2(0) + 3y = 6 –> 3y = 6 –> y = 2
Next, we can choose a third point by plugging in a value for x or y. Let’s plug in x = 1:
- 2(1) + 3y = 6 –> 2 + 3y = 6 –> 3y = 4 –> y = 4⁄3
Now we can plot the points (3, 0), (0, 2), and (1, 4⁄3) on a coordinate plane and draw a line through them to create the graph of the linear equation.

| x | y |
|---|---|
| 3 | 0 |
| 0 | 2 |
| 1 | 4/3 |
📝 Note: The graph of a linear equation is a straight line, and it can be graphed using the x and y intercepts, the slope-intercept form, or a combination of both.
Common Applications of Linear Equations
Linear equations have many real-world applications, including:
- Cost-benefit analysis: Linear equations can be used to model the cost and benefit of different options.
- Resource allocation: Linear equations can be used to allocate resources in a way that maximizes efficiency.
- Physics and engineering: Linear equations can be used to model the motion of objects and the behavior of electrical circuits.
Conclusion
Graphing linear equations is a fundamental skill in mathematics that can be used to solve a wide range of problems. By understanding the standard form of a linear equation, using the slope-intercept form, and applying common applications, you can become proficient in graphing linear equations.
What is the standard form of a linear equation?
+The standard form of a linear equation is Ax + By = C, where A and B are coefficients, x and y are variables, and C is a constant.
How do I graph a linear equation?
+To graph a linear equation, determine the x and y intercepts, choose a third point, plot the points, and draw a line through them.
What is the slope-intercept form of a linear equation?
+The slope-intercept form of a linear equation is y = mx + b, where m is the slope and b is the y-intercept.
Related Terms:
- Linear function graph Worksheet
- Graphing absolute Value Functions pdf
- Math aids graphing


