7 Ways to Master Graphing Exponential Functions

Understanding Exponential Functions
Exponential functions are a fundamental concept in mathematics, and graphing them can be a challenging task for many students. However, with the right approach and techniques, mastering graphing exponential functions can become easier. In this article, we will explore seven ways to help you master graphing exponential functions.
1. Recall the Basic Properties of Exponential Functions
To start with, recall the basic properties of exponential functions. An exponential function is a function that has a constant base raised to a power that is a variable. The general form of an exponential function is:
f(x) = ab^x
where ‘a’ is the coefficient, ‘b’ is the base, and ‘x’ is the exponent.
📝 Note: The base 'b' must be positive and not equal to 1.
2. Identify the Key Features of Exponential Functions
Exponential functions have several key features that can help you graph them. These features include:
- The y-intercept, which is the point where the graph intersects the y-axis.
- The horizontal asymptote, which is the horizontal line that the graph approaches as x goes to infinity or negative infinity.
- The growth rate, which determines how quickly the function increases or decreases.
Here are some key features of exponential functions:

| Feature | Description |
|---|---|
| y-intercept | The point where the graph intersects the y-axis. |
| Horizontal asymptote | The horizontal line that the graph approaches as x goes to infinity or negative infinity. |
| Growth rate | The rate at which the function increases or decreases. |
3. Use a Table to Create a Graph
One way to graph an exponential function is to use a table to create a set of points. Here’s how:
- Choose a set of x-values and calculate the corresponding y-values.
- Plot the points on a coordinate plane.
- Draw a smooth curve through the points.
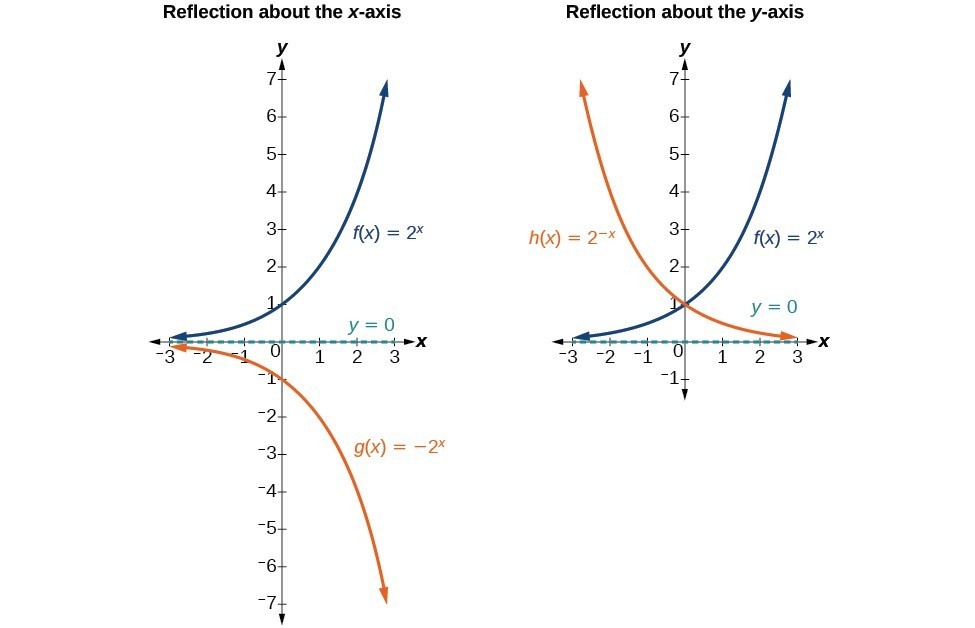
For example, let’s graph the function f(x) = 2^x.
| x | y |
|---|---|
| -2 | 1⁄4 |
| -1 | 1⁄2 |
| 0 | 1 |
| 1 | 2 |
| 2 | 4 |
4. Use a Graphing Calculator
Another way to graph an exponential function is to use a graphing calculator. Here’s how:
- Enter the function into the calculator.
- Set the window to the desired range.
- Graph the function.
For example, let’s graph the function f(x) = 2^x using a graphing calculator.
5. Identify the Type of Exponential Function
Exponential functions can be classified into two types: growth and decay. Growth functions have a base greater than 1, while decay functions have a base between 0 and 1.
Here’s how to identify the type of exponential function:
- If the base is greater than 1, the function is a growth function.
- If the base is between 0 and 1, the function is a decay function.
📝 Note: The type of exponential function determines the direction of the graph.
6. Use the Properties of Exponential Functions to Graph
Exponential functions have several properties that can help you graph them. Here are a few:
- The product rule: If you multiply two exponential functions with the same base, the result is an exponential function with the same base.
- The quotient rule: If you divide two exponential functions with the same base, the result is an exponential function with the same base.
For example, let’s graph the function f(x) = 2^x + 2^(-x).
7. Practice, Practice, Practice
Finally, the key to mastering graphing exponential functions is to practice, practice, practice! The more you practice, the more comfortable you will become with graphing exponential functions.
Here are some practice exercises:
- Graph the function f(x) = 3^x.
- Graph the function f(x) = 2^(-x).
- Graph the function f(x) = 2^x + 2^(-x).
In conclusion, mastering graphing exponential functions requires a combination of understanding the properties of exponential functions, using tables and graphing calculators, and practicing, practicing, practicing. By following these seven steps, you can become proficient in graphing exponential functions.
What is the difference between a growth and decay exponential function?
+
A growth exponential function has a base greater than 1, while a decay exponential function has a base between 0 and 1.
How do I graph an exponential function using a table?
+
To graph an exponential function using a table, choose a set of x-values and calculate the corresponding y-values, then plot the points on a coordinate plane and draw a smooth curve through the points.
What is the product rule for exponential functions?
+
The product rule for exponential functions states that if you multiply two exponential functions with the same base, the result is an exponential function with the same base.
Related Terms:
- Graphing Exponential Functions Worksheet 2
- Writing exponential functions Worksheet PDF
- Graphing exponential functions notes


