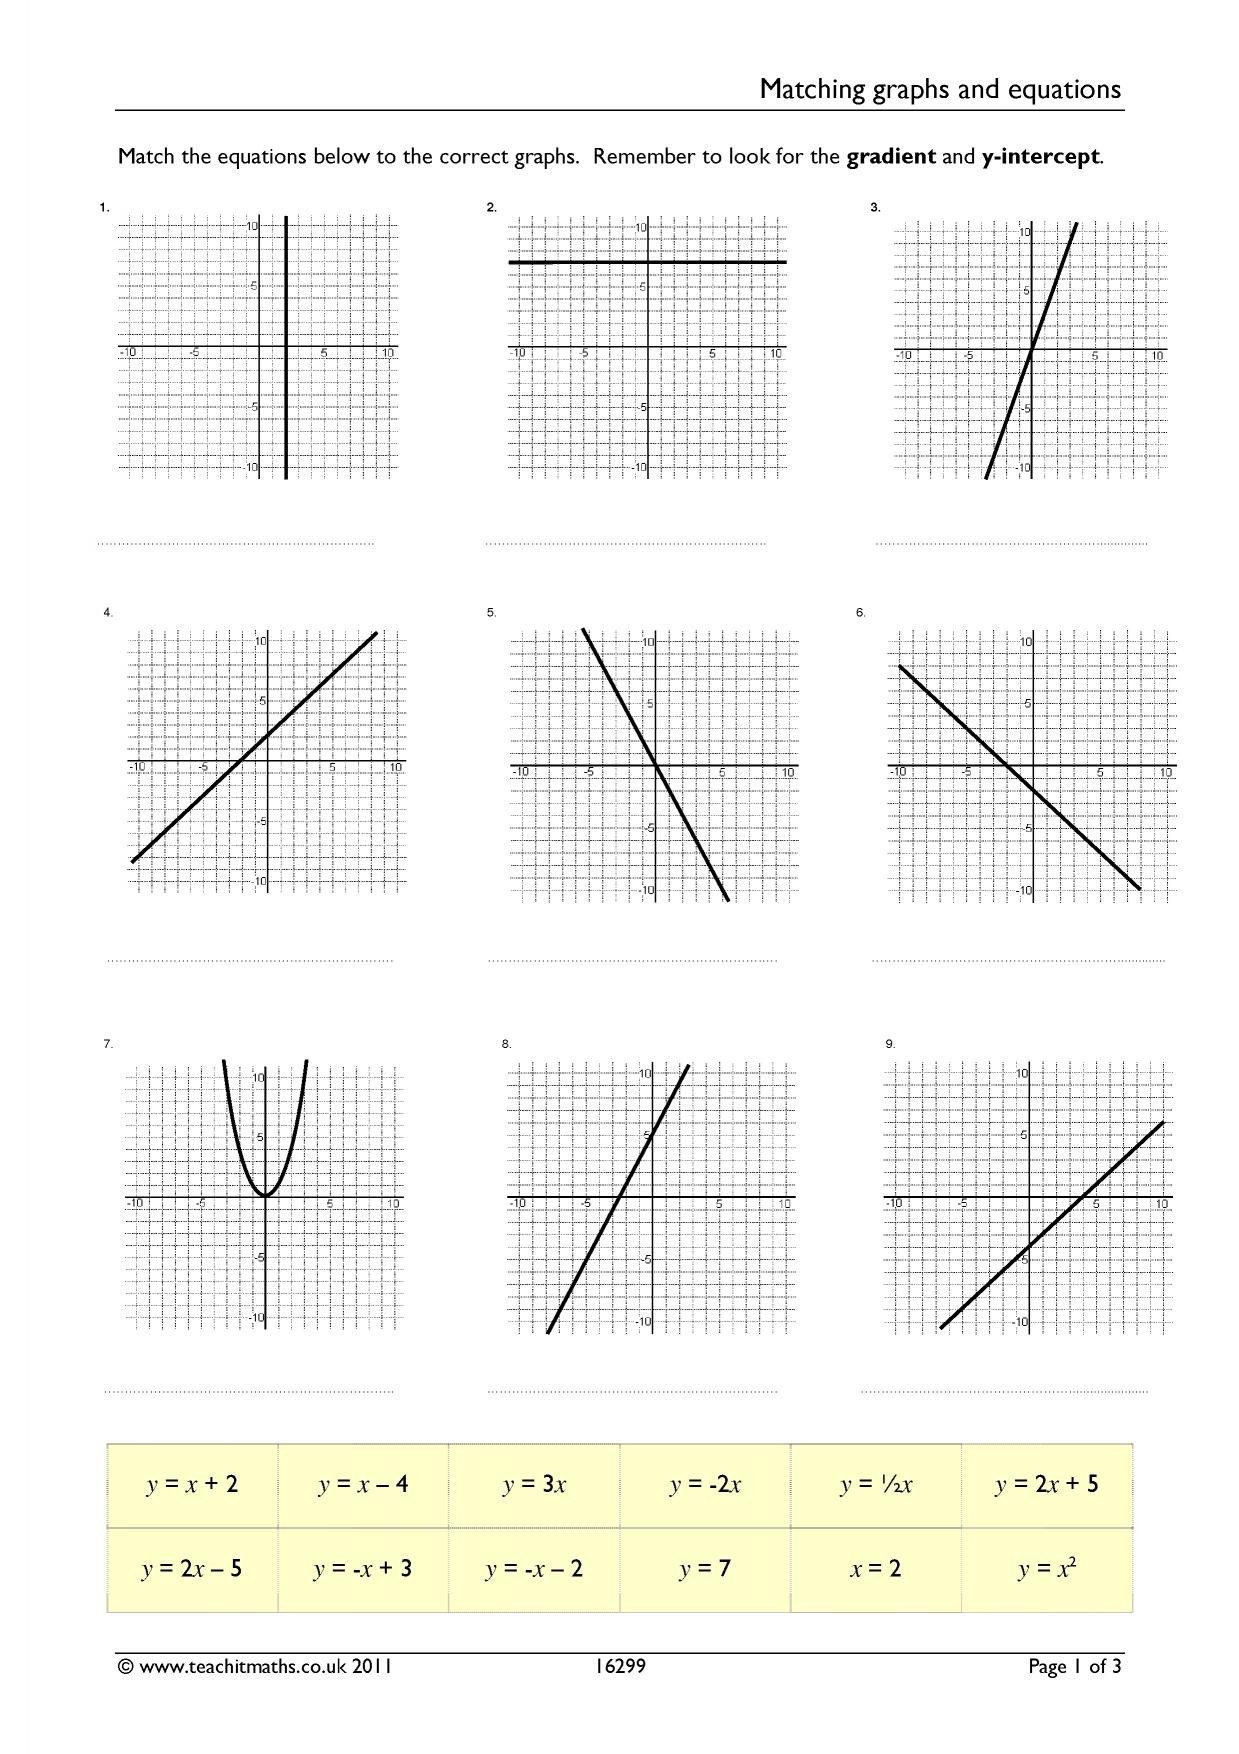
Graphing Equations Worksheet
Understanding Graphing Equations: A Comprehensive Guide
Graphing equations is a fundamental concept in mathematics, particularly in algebra and geometry. It involves creating a visual representation of an equation on a coordinate plane to better understand the relationship between variables. In this guide, we will delve into the world of graphing equations, exploring the different types of equations, their graphs, and providing a worksheet to help you practice.
Types of Equations and Their Graphs
There are several types of equations, each with its unique graph. Let’s explore some of the most common types:
Linear Equations
A linear equation is an equation in which the highest power of the variable(s) is 1. The graph of a linear equation is a straight line. The general form of a linear equation is:
y = mx + b
Where:
- m is the slope of the line
- b is the y-intercept
Example: y = 2x + 3
Quadratic Equations
A quadratic equation is an equation in which the highest power of the variable(s) is 2. The graph of a quadratic equation is a parabola. The general form of a quadratic equation is:
y = ax^2 + bx + c
Where:
- a is the coefficient of the squared term
- b is the coefficient of the linear term
- c is the constant term
Example: y = x^2 + 4x + 4
Exponential Equations
An exponential equation is an equation in which the variable is in the exponent. The graph of an exponential equation is a curve that increases or decreases rapidly. The general form of an exponential equation is:
y = ab^x
Where:
- a is the coefficient
- b is the base
- x is the exponent
Example: y = 2^x
Graphing Equations: A Step-by-Step Guide
Now that we have explored the different types of equations, let’s learn how to graph them. Here’s a step-by-step guide:
Step 1: Identify the Type of Equation
Determine the type of equation you are working with. Is it linear, quadratic, or exponential?
Step 2: Determine the X and Y Intercepts
Find the x and y intercepts of the equation. The x-intercept is the point where the graph crosses the x-axis, while the y-intercept is the point where the graph crosses the y-axis.
Step 3: Plot the Intercepts
Plot the x and y intercepts on the coordinate plane.
Step 4: Draw the Graph
Use the intercepts and the type of equation to draw the graph. For linear equations, draw a straight line through the intercepts. For quadratic equations, draw a parabola that opens upwards or downwards. For exponential equations, draw a curve that increases or decreases rapidly.
Graphing Equations Worksheet
Now that you have learned how to graph equations, it’s time to practice. Here’s a worksheet with 10 equations for you to graph:
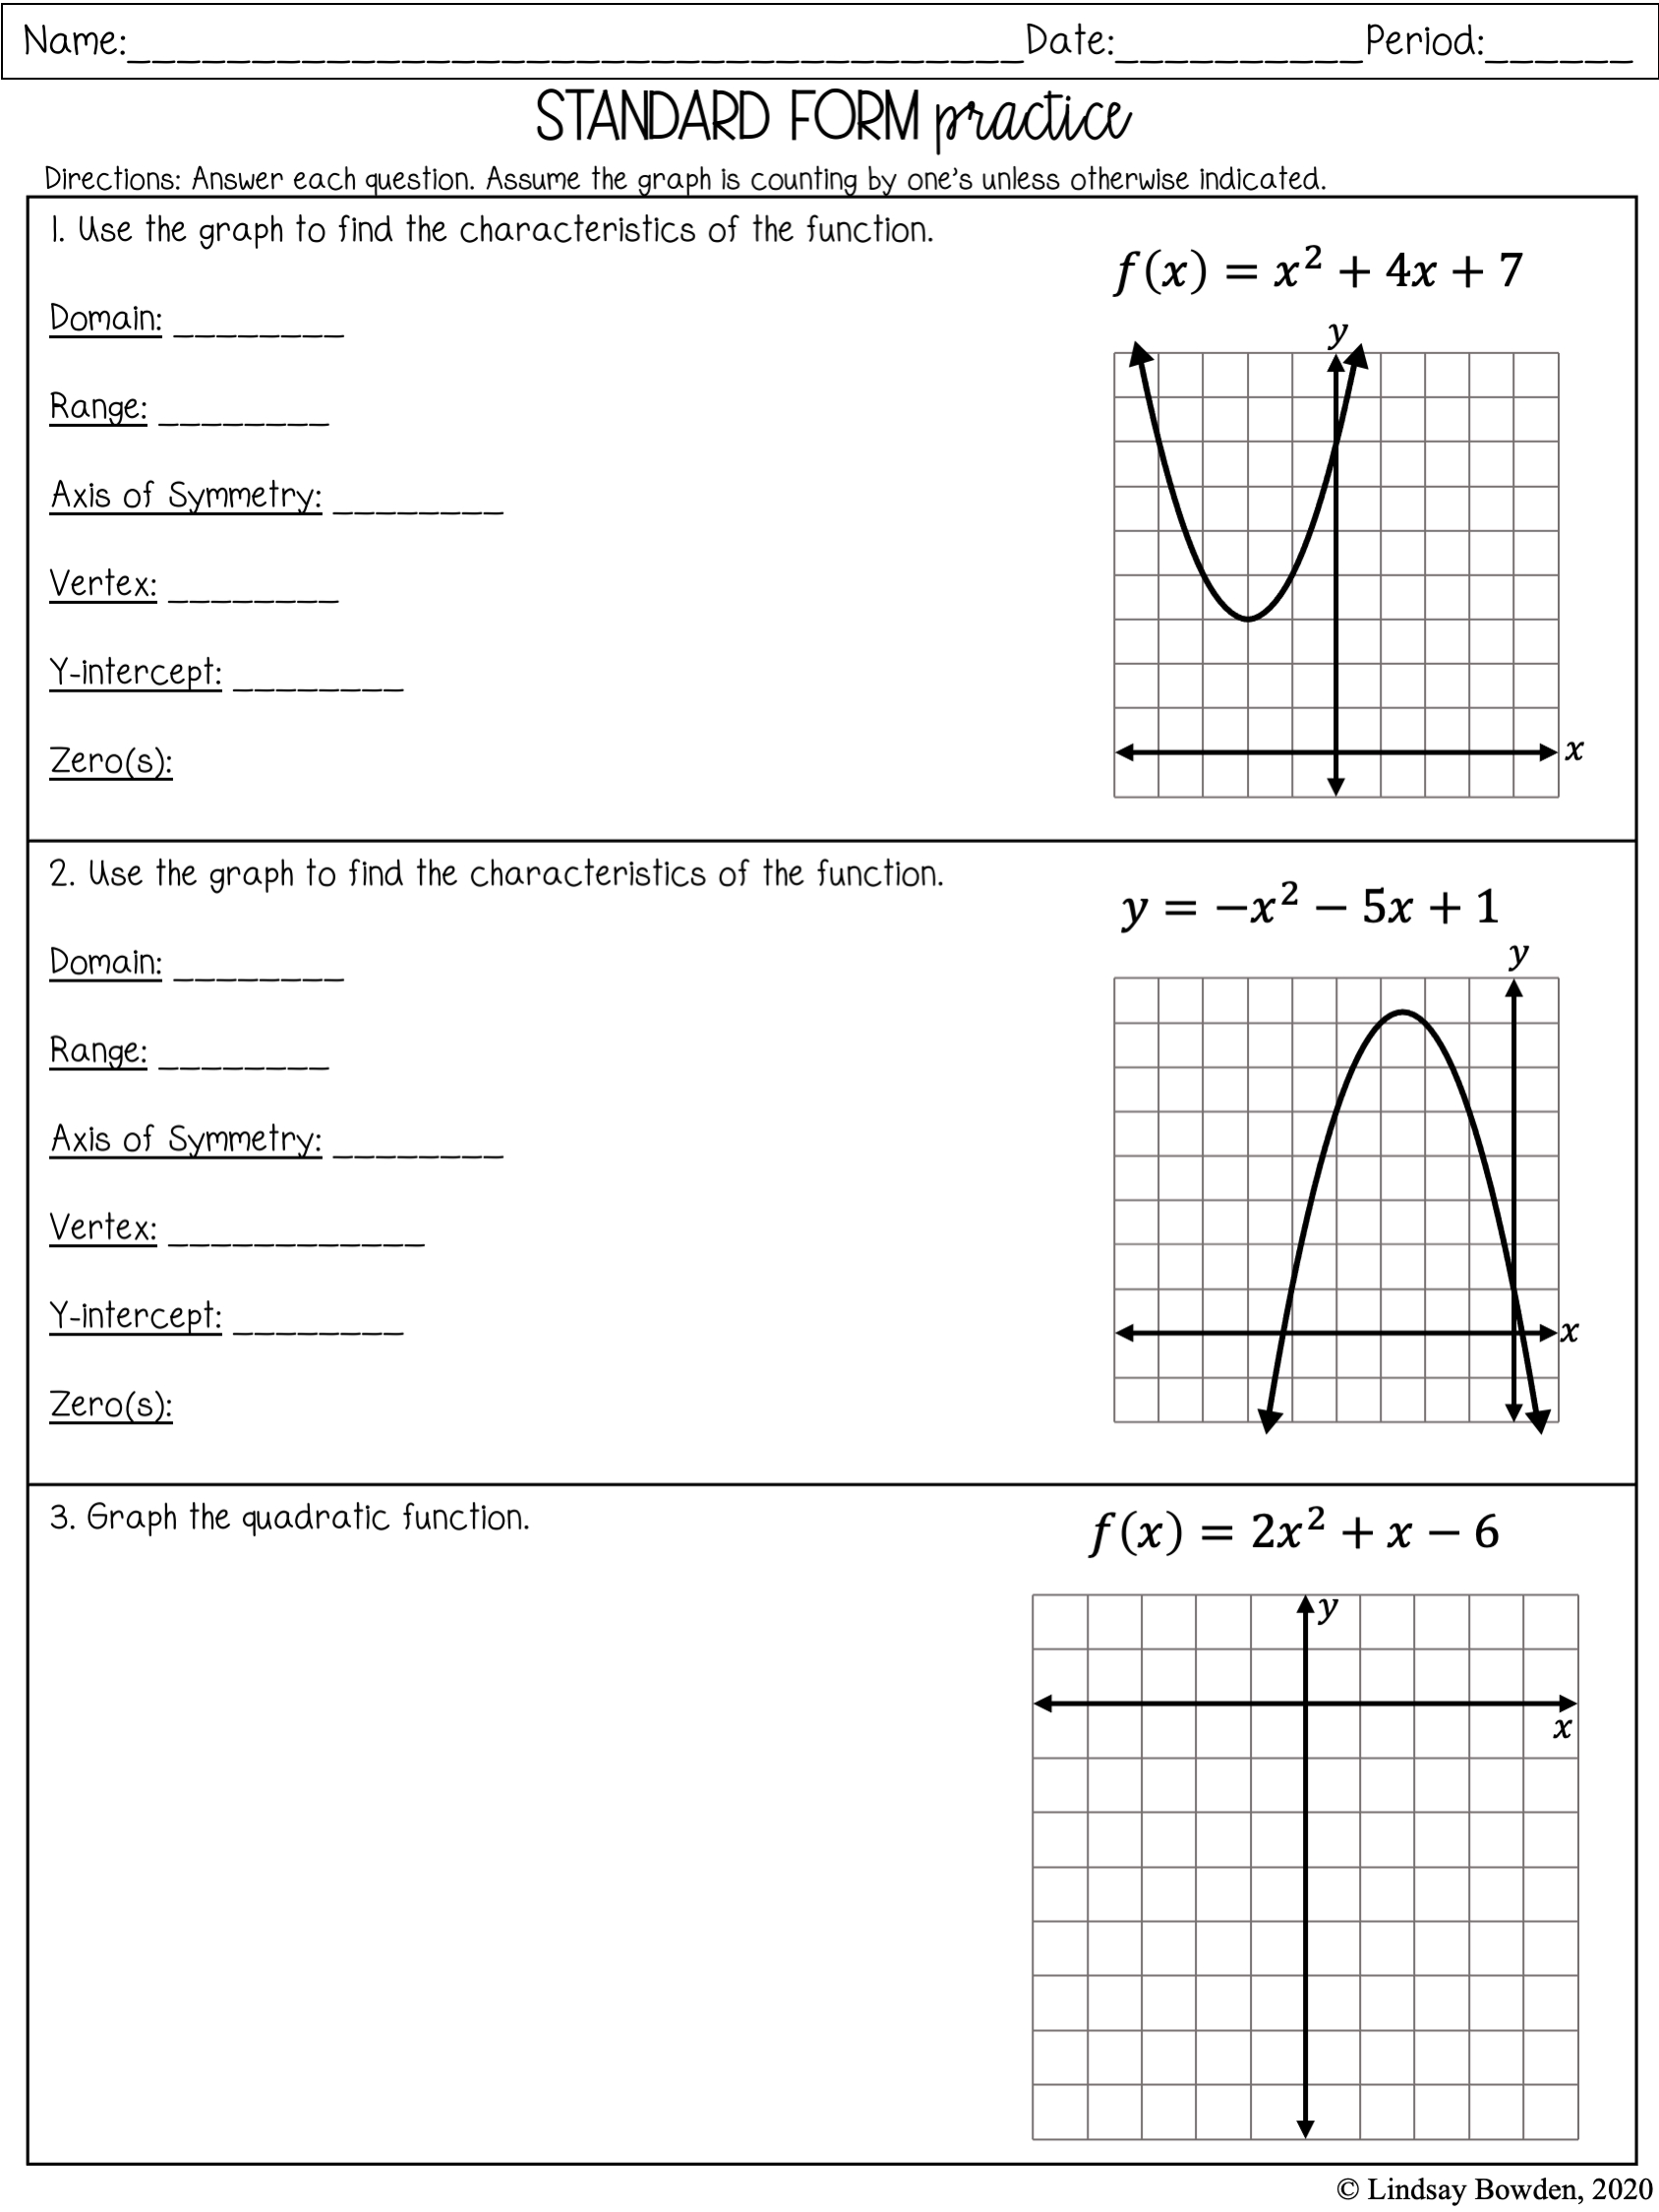
| Equation | Graph |
|---|---|
| y = 2x + 1 | ___________ |
| y = x^2 - 4x + 4 | ___________ |
| y = 3^x | ___________ |
| y = -2x + 5 | ___________ |
| y = x^2 + 2x - 3 | ___________ |
| y = 2^(-x) | ___________ |
| y = x - 2 | ___________ |
| y = x^2 - 2x - 6 | ___________ |
| y = 4^x | ___________ |
| y = -x + 3 | ___________ |
📝 Note: Use the steps outlined above to graph each equation. You can use graph paper or a graphing calculator to help you visualize the graphs.
In conclusion, graphing equations is an essential skill in mathematics that can help you visualize and understand complex relationships between variables. By following the steps outlined above and practicing with the worksheet, you can become proficient in graphing equations and unlock the secrets of mathematics.
What is the difference between a linear and quadratic equation?
+A linear equation is an equation in which the highest power of the variable(s) is 1, while a quadratic equation is an equation in which the highest power of the variable(s) is 2.
How do I determine the x and y intercepts of an equation?
+To determine the x-intercept, set y = 0 and solve for x. To determine the y-intercept, set x = 0 and solve for y.
What is the purpose of graphing equations?
+The purpose of graphing equations is to visualize and understand the relationship between variables. Graphing equations can help you identify patterns, trends, and relationships that may not be apparent from the equation alone.
Related Terms:
- Linear function graph Worksheet
- Linear graph Worksheet pdf
- Slope from a graph Worksheet
- Kuta slope Worksheet
