Graph Sine and Cosine Functions Made Easy

Introduction to Graphing Sine and Cosine Functions
Graphing sine and cosine functions can seem intimidating at first, but with a solid understanding of the concepts and a step-by-step approach, it can become a manageable task. In this article, we will break down the process of graphing sine and cosine functions into easy-to-follow steps, providing you with a comprehensive guide to mastering these fundamental trigonometric functions.
Understanding Sine and Cosine Functions
Before we dive into graphing, let’s review the definitions of sine and cosine functions.
- The sine function is defined as the ratio of the length of the side opposite a given angle to the length of the hypotenuse in a right triangle.
- The cosine function is defined as the ratio of the length of the side adjacent to a given angle to the length of the hypotenuse in a right triangle.
These definitions can be represented mathematically as:
sin(x) = opposite side / hypotenuse cos(x) = adjacent side / hypotenuse
Key Characteristics of Sine and Cosine Functions
To graph sine and cosine functions, you need to be familiar with their key characteristics:
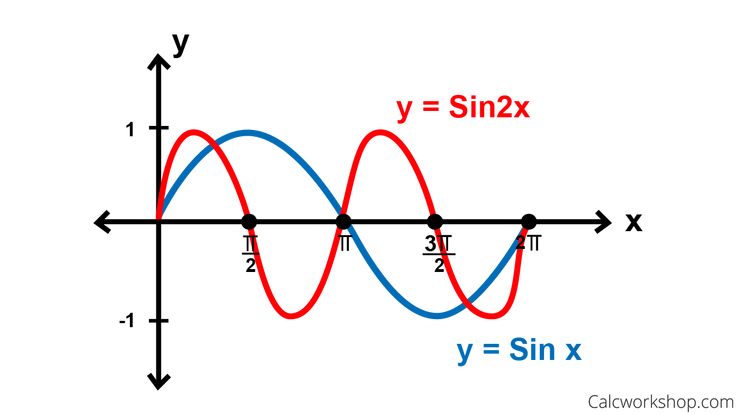
- Period: The period of a function is the distance along the x-axis over which the function repeats. The period of sine and cosine functions is 2π.
- Amplitude: The amplitude of a function is the maximum value it attains. The amplitude of sine and cosine functions is 1.
- Phase Shift: The phase shift of a function is the horizontal displacement of the function. The phase shift of sine and cosine functions can be adjusted using the general equation y = sin(x - c) or y = cos(x - c), where c is the phase shift.
- Vertical Shift: The vertical shift of a function is the vertical displacement of the function. The vertical shift of sine and cosine functions can be adjusted using the general equation y = sin(x) + c or y = cos(x) + c, where c is the vertical shift.
Graphing Sine and Cosine Functions
Now that we have reviewed the key characteristics of sine and cosine functions, let’s move on to graphing them.
Step 1: Determine the Period
Identify the period of the function by looking at the coefficient of the x-term. If the coefficient is 1, the period is 2π. If the coefficient is not 1, the period can be found using the formula:
period = 2π / |coefficient|
Step 2: Determine the Amplitude
Identify the amplitude of the function by looking at the coefficient of the sine or cosine term. If the coefficient is 1, the amplitude is 1. If the coefficient is not 1, the amplitude is equal to the absolute value of the coefficient.
Step 3: Determine the Phase Shift
Identify the phase shift of the function by looking at the constant term inside the sine or cosine function. If the constant term is 0, there is no phase shift. If the constant term is not 0, the phase shift can be found using the formula:
phase shift = -constant term
Step 4: Determine the Vertical Shift
Identify the vertical shift of the function by looking at the constant term outside the sine or cosine function. If the constant term is 0, there is no vertical shift. If the constant term is not 0, the vertical shift is equal to the constant term.
Step 5: Graph the Function
Using the information gathered in the previous steps, graph the sine or cosine function.
- Start by graphing the basic sine or cosine function.
- Adjust the period, amplitude, phase shift, and vertical shift accordingly.
📝 Note: When graphing sine and cosine functions, it's essential to identify the key characteristics and adjust the graph accordingly.
Example Problems
Let’s work through some example problems to solidify our understanding of graphing sine and cosine functions.
Example 1: Graph y = sin(x)
- Period: 2π
- Amplitude: 1
- Phase Shift: 0
- Vertical Shift: 0
Graph the basic sine function.
Example 2: Graph y = 2cos(x - π/2) + 1
- Period: 2π
- Amplitude: 2
- Phase Shift: π/2
- Vertical Shift: 1
Adjust the period, amplitude, phase shift, and vertical shift accordingly.
Common Mistakes to Avoid
When graphing sine and cosine functions, here are some common mistakes to avoid:
- Incorrect period: Make sure to identify the correct period by looking at the coefficient of the x-term.
- Incorrect amplitude: Make sure to identify the correct amplitude by looking at the coefficient of the sine or cosine term.
- Incorrect phase shift: Make sure to identify the correct phase shift by looking at the constant term inside the sine or cosine function.
- Incorrect vertical shift: Make sure to identify the correct vertical shift by looking at the constant term outside the sine or cosine function.
📝 Note: Avoid these common mistakes by double-checking your work and ensuring you have identified the correct key characteristics.
Conclusion
Graphing sine and cosine functions can seem intimidating at first, but by understanding the key characteristics and following a step-by-step approach, it can become a manageable task. Remember to identify the period, amplitude, phase shift, and vertical shift, and adjust the graph accordingly. Practice makes perfect, so work through example problems to solidify your understanding. With time and practice, you’ll become proficient in graphing sine and cosine functions.
What is the period of the sine function?
+The period of the sine function is 2π.
What is the amplitude of the cosine function?
+The amplitude of the cosine function is 1.
How do I find the phase shift of a sine function?
+The phase shift of a sine function can be found by looking at the constant term inside the sine function. If the constant term is 0, there is no phase shift. If the constant term is not 0, the phase shift can be found using the formula: phase shift = -constant term.


