Graph Linear Equations Worksheet

Understanding Linear Equations
Linear equations are equations in which the highest power of the variable(s) is 1. They are called linear because the graph of a linear equation is a straight line. In this post, we will explore how to graph linear equations and provide a worksheet for practice.
Forms of Linear Equations
There are three main forms of linear equations:
- Slope-Intercept Form: y = mx + b, where m is the slope and b is the y-intercept.
- Standard Form: Ax + By = C, where A, B, and C are constants.
- Point-Slope Form: y - y1 = m(x - x1), where m is the slope and (x1, y1) is a point on the line.
Graphing Linear Equations
To graph a linear equation, you can use the following steps:
- Identify the form of the equation. If it’s not in slope-intercept form, rewrite it.
- Determine the slope (m) and y-intercept (b).
- Plot the y-intercept on the graph.
- Use the slope to find another point on the line.
- Draw a straight line through the two points.
Example 1: Graphing a Linear Equation in Slope-Intercept Form
Suppose we want to graph the equation y = 2x + 3.
- The equation is already in slope-intercept form.
- The slope is 2, and the y-intercept is 3.
- Plot the point (0, 3) on the graph.
- Use the slope to find another point on the line. For example, if x = 1, then y = 2(1) + 3 = 5. So, plot the point (1, 5).
- Draw a straight line through the two points.
📝 Note: You can also use a table of values to graph a linear equation. Simply plug in different values for x and calculate the corresponding y-values.
Example 2: Graphing a Linear Equation in Standard Form
Suppose we want to graph the equation 2x + 3y = 6.
- Rewrite the equation in slope-intercept form. Subtract 2x from both sides to get 3y = -2x + 6. Then, divide both sides by 3 to get y = (-2⁄3)x + 2.
- The slope is -2⁄3, and the y-intercept is 2.
- Plot the point (0, 2) on the graph.
- Use the slope to find another point on the line. For example, if x = 1, then y = (-2⁄3)(1) + 2 = 4⁄3. So, plot the point (1, 4⁄3).
- Draw a straight line through the two points.
Worksheet: Graphing Linear Equations
Graph the following linear equations:
- y = 3x - 2
- 2x + 5y = 10
- y - 2 = -4(x - 1)
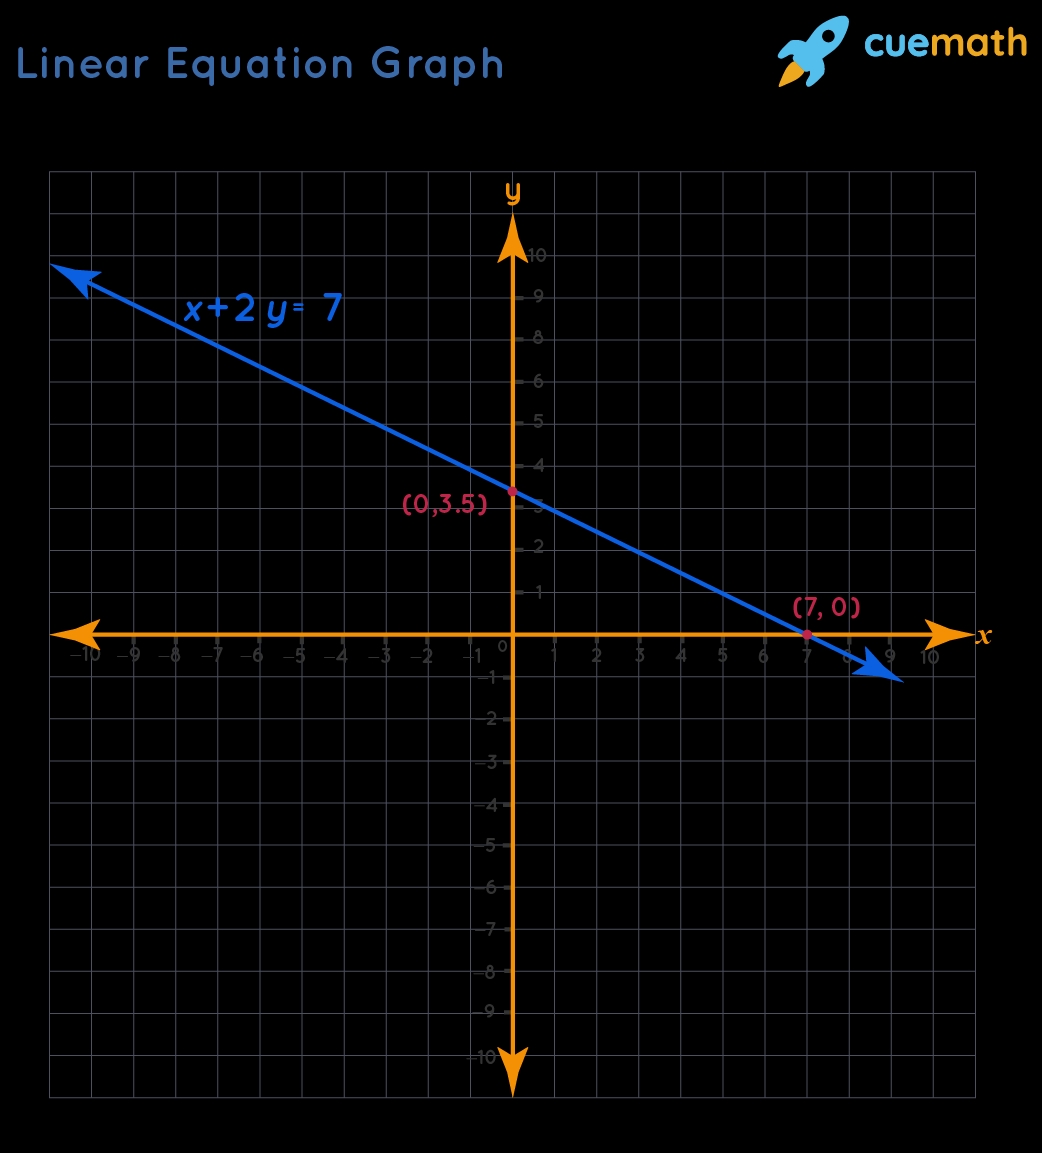
- x + 2y = 7
- y = (1⁄2)x + 3
📝 Note: Use the steps outlined above to graph each equation.
Answer Key
- y = 3x - 2: slope = 3, y-intercept = -2
- 2x + 5y = 10: slope = -2⁄5, y-intercept = 2
- y - 2 = -4(x - 1): slope = -4, y-intercept = 6
- x + 2y = 7: slope = -1⁄2, y-intercept = 7⁄2
- y = (1⁄2)x + 3: slope = 1⁄2, y-intercept = 3
What is the slope of a linear equation?
+The slope of a linear equation is a measure of how steep the line is. It is calculated as the change in y divided by the change in x.
How do I graph a linear equation in standard form?
+To graph a linear equation in standard form, rewrite the equation in slope-intercept form, then plot the y-intercept and use the slope to find another point on the line.
What is the point-slope form of a linear equation?
+The point-slope form of a linear equation is y - y1 = m(x - x1), where m is the slope and (x1, y1) is a point on the line.
By following these steps and practicing with the worksheet, you should be able to graph linear equations with ease. Remember to identify the form of the equation, determine the slope and y-intercept, and use the slope to find another point on the line.


