5 Ways to Graph Absolute Value Equations

Understanding Absolute Value Equations
Absolute value equations are a fundamental concept in mathematics, particularly in algebra and graphing. These equations involve the absolute value of a variable or expression, which is denoted by the vertical bars | |. The absolute value of a number is its distance from zero on the number line, regardless of direction. In this article, we will explore five ways to graph absolute value equations, including understanding the basic properties, using tables, applying transformations, and more.
Method 1: Understanding Basic Properties
To graph an absolute value equation, it’s essential to understand the basic properties of absolute value functions. The most common absolute value function is f(x) = |x|, which represents the distance of x from zero on the number line. This function has the following properties:
- It is always non-negative (or zero).
- It is symmetric about the y-axis.
- It has a minimum value of zero at x = 0.
By understanding these properties, you can graph the basic absolute value function f(x) = |x|, which is a V-shaped graph with its vertex at (0, 0).
Method 2: Using Tables
Another way to graph absolute value equations is by using tables. This method involves creating a table of values for the equation and plotting the corresponding points on a coordinate plane. For example, consider the equation f(x) = |2x - 3|. You can create a table of values as follows:
| x | 2x - 3 | f(x) = |2x - 3| |

| -1 | -5 | 5 |
| 0 | -3 | 3 |
| 1 | -1 | 1 |
| 2 | 1 | 1 |
| 3 | 3 | 3 |
By plotting these points on a coordinate plane, you can graph the absolute value equation.
Method 3: Applying Transformations
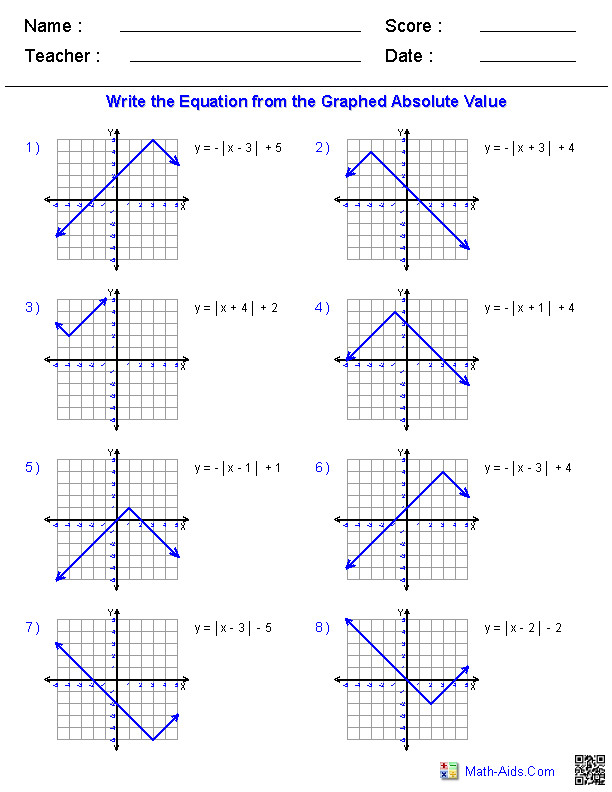
Absolute value equations can be transformed by applying various techniques, such as horizontal shifts, vertical shifts, and stretches. For example, consider the equation f(x) = |x - 2| + 1. This equation represents a horizontal shift of 2 units to the right and a vertical shift of 1 unit up from the basic absolute value function f(x) = |x|.
By applying these transformations, you can graph the absolute value equation.
Method 4: Using the Piecewise Method
Another way to graph absolute value equations is by using the piecewise method. This method involves breaking the equation into two or more pieces, each with its own domain and range. For example, consider the equation f(x) = |x|, which can be rewritten as:
f(x) = x, x ≥ 0 f(x) = -x, x < 0
By graphing each piece separately, you can create the graph of the absolute value equation.
Method 5: Graphing Absolute Value Inequalities
Finally, you can graph absolute value equations by graphing absolute value inequalities. An absolute value inequality is an inequality that involves the absolute value of a variable or expression. For example, consider the inequality |x| > 2. This inequality represents all values of x that are more than 2 units away from zero on the number line.
By graphing the inequality, you can create a graph that represents all possible solutions.
💡 Note: When graphing absolute value equations, it's essential to pay attention to the direction of the inequality. A greater-than inequality (>) will result in a graph that opens outward, while a less-than inequality (<) will result in a graph that opens inward.
What is the basic property of absolute value functions?
+The basic property of absolute value functions is that they are always non-negative (or zero), symmetric about the y-axis, and have a minimum value of zero at x = 0.
How can I graph absolute value equations using tables?
+To graph absolute value equations using tables, create a table of values for the equation and plot the corresponding points on a coordinate plane.
What is the piecewise method for graphing absolute value equations?
+The piecewise method involves breaking the equation into two or more pieces, each with its own domain and range. By graphing each piece separately, you can create the graph of the absolute value equation.
By following these five methods, you can effectively graph absolute value equations and develop a deeper understanding of this fundamental concept in mathematics.
Related Terms:
- Absolute Value graphs Worksheet pdf
- Absolute Value Functions Worksheet answers
- Absolute value Functions Transformations Worksheet


